
Genetic and anthropometric studies on Thai people
Research on the population of Thailand groups it by the family each language belongs to: Tai-Kadai, Austroasiatic, Sino-Tibetan, Hmong-Mien and Austronesian. Genetic structure follows these families, though with wide variation within several of them. Differences between the country's four regions are slight and follow a gradient rather than a boundary, with resemblance to Tai-Kadai-speaking populations of southern China declining from north to south. Regional grouping accounts for under 1 percent of the variation. The largest set of skull measurements from the country gives a similar result, with three regional samples failing to separate from one another.
The origin of Tai-Kadai speakers in mainland Southeast Asia is dated differently in the genetic and linguistic studies. A dated tree of the family's languages places their spread into mainland Southeast Asia within the last 2,000 years and gives the Guangxi–Guangdong coast as the most likely starting point. A study of maternal lineages from nineteen Tai-speaking populations instead places their formation in southern Yunnan. Other genetic studies have examined the question using both maternal and paternal lineages and whole genomes. The mid-20th-century view that made the Yunnan kingdom of Nanzhao a centre of Tai expansion has since been rejected. Ancient genomes associate the arrival of East Asian-related ancestry with the spread of farming. The authors interpret this as admixture with resident populations rather than population replacement. The hunter-gatherer populations present before this transition are genetically closest to the Onge of the Andaman Islands.
Genetic variation is not distributed evenly among the populations studied. Austroasiatic-speaking populations differ from one another by about twice as much as Tai-Kadai populations in repeated sequences, and the difference is even greater in Y chromosome variation. At the other end of the spectrum, the Mlabri are among the most genetically uniform populations studied in the region, while the Maniq of the far south carry maternal lineages that diverged early in the human genetic tree. Evidence of South Asian-related ancestry has also been found in central and southern populations and among the Mon, with estimates placing its arrival between about 500 and 1,200 years ago. These differences have also been relevant to forensic research: reference databases based on Thai samples show differences from neighbouring Asian populations both in the lineages represented and in their frequencies. Similarly, variants of immune-system genes associated with severe drug reactions occur at frequencies that differ substantially from those reported in European and North American reference populations.
Background
Studies of Thailand's populations group them by the family their language belongs to: Tai-Kadai, Austroasiatic, Sino-Tibetan, Hmong-Mien and Austronesian. Tai and Thai are not interchangeable. Tai is one of five branches of the first of those families. That family, also called Kra-Dai, has close to 100 million speakers across South China, mainland Southeast Asia and northeastern India. The reverse does not hold either: the Lao Isan of the northeast hold Thai citizenship and are described as ethnically Lao. How those languages and their speakers reached the country has been read from paternal and maternal lineages, from whole genomes, and from the languages themselves, and the readings do not all agree.
Terminology: Tai, Thai, Siam, and Xian
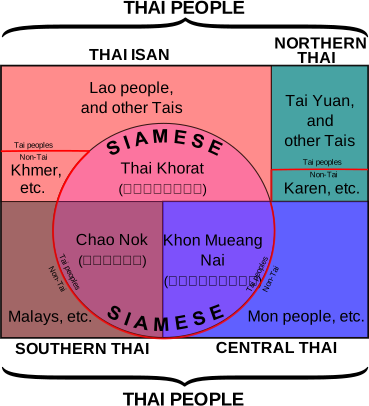 In English, Tai refers to speakers of languages in the Tai family, most of whom, particularly speakers of Southwestern Tai languages, call themselves Tai or a cognate. Thai now refers to citizens of Thailand and, more narrowly, to the Siamese. Xiān was also used in historical Vietnamese and Chinese sources for polities or peoples in the Chao Phraya basin.
Siam is a loanword rather than a native Tai term. A 2024 study connects it with shan in Burmese, sem in Mon, and siem in Khmer, and argues that these terms were applied by outsiders to speakers of Tai languages who called themselves Tai. Burmese and Mon usage could cover both Thai and Lao, while Shan and Lao could denote political status rather than descent. The linguistic distinction is also reflected in Thai: Siam follows Pali and Sanskrit word order, whereas Thai follows native Thai word order. Before the 19th century, Tai and Lao also had multiple meanings. Tai could refer either to an inhabitant of a place or to a free person, in contrast to a slave, and the Sukhothai inscription traditionally dated to 1292 uses the term in both senses. In the same period, Lao could mean a lord or ruler. The terms may therefore have described social status rather than ancestry or descent.
The earliest attestations of Siam and Thai are uncertain. A 1949 study identified syam on the bas-reliefs of Angkor Wat, dated to about 1150, where Khmer inscriptions refer to mercenaries as syam-kuk. A 1988 study instead dates the term to Old Khmer inscriptions from 611, where it probably denotes a place in the lower Chao Phraya basin and possibly its inhabitants. It cautions that the identity of the syam-kuk mercenaries cannot be established, although they have often been identified as Thai. Thai is securely attested in the Sukhothai inscription traditionally dated to 1292, where it occurs more than twenty times as a name for a people. Tai was not primarily a state name.
La Loubère described Siam as a Portuguese term and reported that the Siamese called themselves Tai rather than Siamese. similarly wrote that foreigners called the kingdom Siam, while its inhabitants knew it as Muang Thai. Both accounts distinguished the northern peoples as Lao; in La Loubère's account, they referred to themselves as Tai Yai. The 2024 study concludes that before the 19th century, Siam, Thai, and Lao were not yet fixed names for nations or ethnic groups, but terms whose meanings varied with context and speaker.
By the mid-19th century, French sources increasingly treated Thai and Siam as referring to the same territory and population; a dictionary published in 1836, for example, equated Siam with Muang Thai. This usage, however, did not extend Thai to Tai-speaking peoples outside the kingdom. A 1949 study dates attempts to extend the term Thai to the Lao and other Tai-speaking peoples to the reign of Chulalongkorn. Siam remained the official name until 1939, when it was replaced by Prathet Thai and Thailand. A 1988 study distinguishes the modern ethnic and linguistic sense of Thai from its legal sense as nationality; the two largely overlap for the majority population, but not necessarily for highland peoples or Malay-speaking Muslims in the south.
Origins and routes
Historical accounts
The account current in the middle of the 20th century, set out in a 1949 survey of the historical record, placed the earliest Tai in the mountains of southern China. It held that Tai-speaking groups moved down the Mekong from about the 12th century, with the Yunnan kingdom of Nanzhao as one of their centres. Sukhothai was regarded as the first Tai kingdom in the region, in the middle of the 13th century, followed by Lan Na in 1292 and Lan Xang in 1353.
The identification of Nanzhao as a Tai kingdom has since been rejected. The idea goes back to Terrien de Lacouperie in the 1880s, who identified the Ai-Lao of western Yunnan as Tai because the Nanzhao rulers claimed them as ancestors, and saw modern Thai and Lao as refugees from the kingdom's fall. The names used by Nanzhao and the vocabulary preserved in Chinese transcription are instead those of Tibeto-Burman speakers. The main population of the Dali basin also speaks a language unrelated to Tai, while evidence for Tai languages in the region begins only in the 11th century. A review of the evidence concludes that any Tai present there played no part in founding the kingdom, places the Tai homeland in Guangxi, and sees Nanzhao as an obstacle to movement north rather than a starting point.
Contemporary records give the name a much earlier history than that account allows. The term syam occurs in Old Khmer inscriptions from the pre-Angkorian period, with the earliest securely dated example from 611. The name appears again in foreign records in the 12th century: the Đại Việt court recorded Xian () in 1149, while the Chinese Lingwai Daida of 1178 records San-lo (), an early transcription that has been linked to the same name. What Xian referred to is itself disputed. A 1988 study reads it as probably Sukhothai, while a later study rejects that identification and places it among the port-polities of the Gulf of Thailand, Ayodhya, Suphanburi and probably Ligor. The dynasty's own account of its origins survives in written instructions prepared in 1684 for a Siamese embassy to Portugal. The envoys were instructed to say that the reigning king descended from a king who ruled in 1300 of the Buddhist era, AD 756 or 757.
Later research places the spread of Tai-Kadai speakers into mainland Southeast Asia before the 12th century. A dated tree of the family's languages places this movement within the last 2,000 years. Complete maternal genomes from Thailand and Laos likewise place it within the last 1,000 to 2,000 years. Ancient genomes from the region show that, by about 2,000 years ago, a component of East Asian ancestry had appeared that was absent from late Neolithic remains. The study reporting this finding interprets it as evidence for the introduction of the ancestral Kra-Dai languages to the mainland.
Linguistic dating
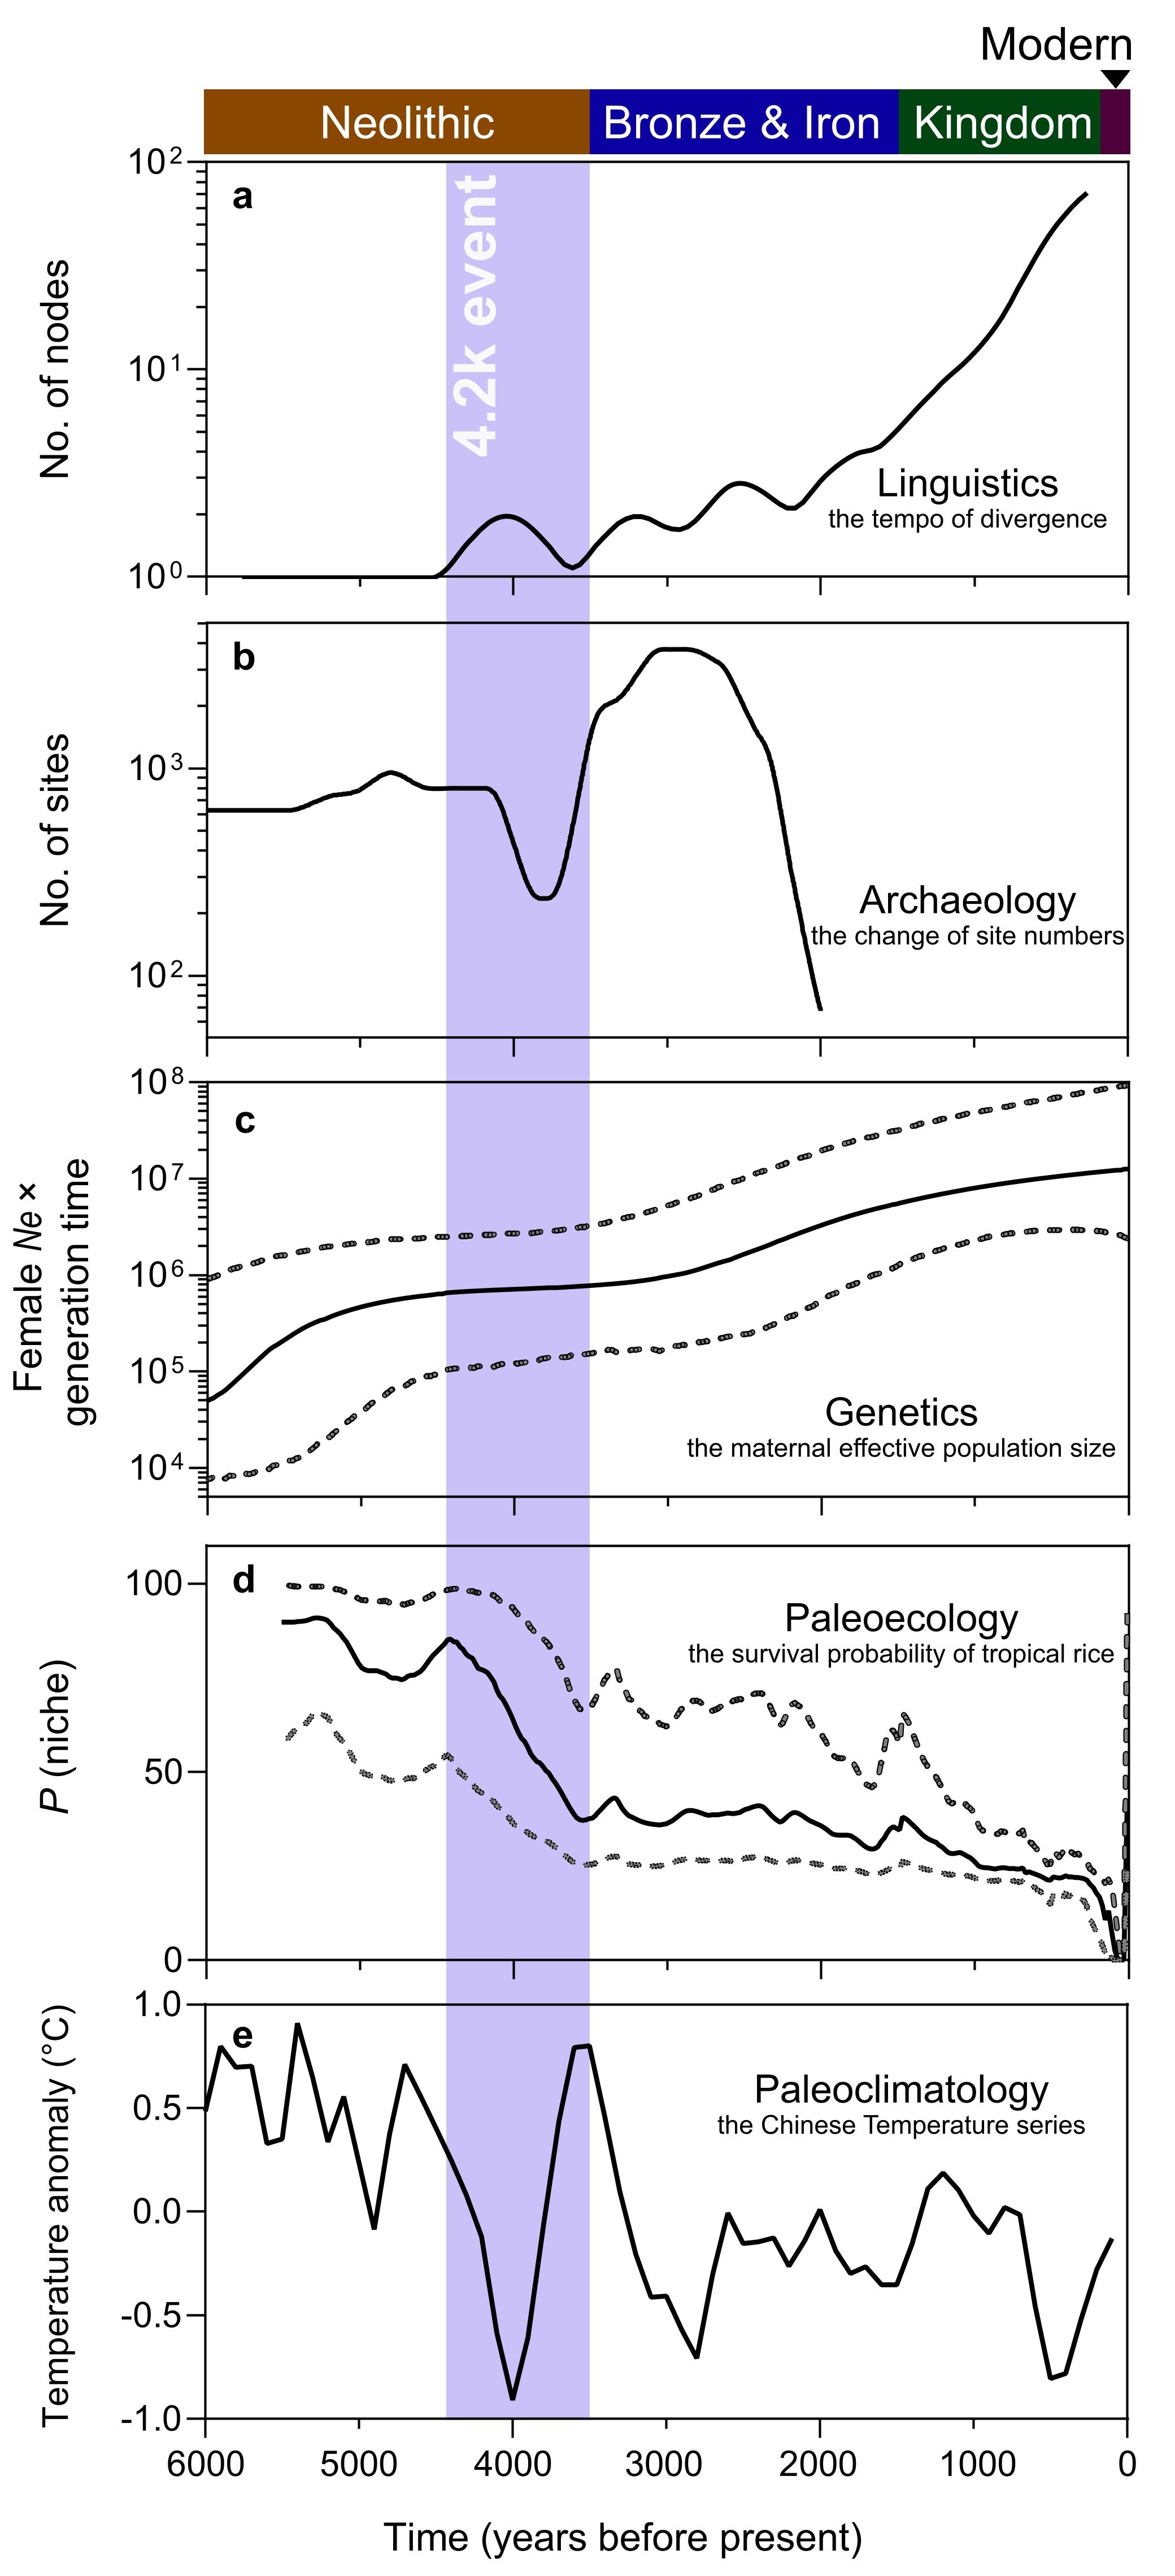
A dated family tree of the Tai-Kadai languages has also been built from word lists rather than genetic data. Comparing 646 sets of related words across 100 languages, it places the first split in the family at about 4,000 years ago, with an estimated range of roughly 2,700 to 5,500 years. The most probable starting point for the spread is the Guangxi and Guangdong coast of southern China rather than the inland provinces. The coastal region has a 47 percent probability, compared with 19 percent or less for each of the four other locations tested. The spread into mainland Southeast Asia is dated to within the last 2,000 years. The same study compares these language splits with an increase in population size estimated from maternal lineages in Tai-Kadai-speaking samples, 266 of which came from Thailand. It links the two to a cold period between about 4,400 and 3,500 years ago. The authors also note that the earlier spread of farming into mainland Southeast Asia is associated with Austroasiatic speakers rather than Tai-Kadai speakers.
Proposed origins
Five maternal lineages found across Thailand and Laos have been proposed as having arisen in the area itself: B5a1d, B6a, R22, R9b and F1f. A maternal survey of 719 people in 19 Tai-speaking populations, from southern China to northeastern India, gives a different starting point. Three lineages carried by about a third of that set, F1a, M7b and B5a, have their root types concentrated in southern Yunnan. Its authors read the Tai as having formed there after descending from populations of southern China. The people sampled in Thailand, Myanmar, Cambodia and northeastern India sit mostly on the outer branches of those lineages, which they read as later arrival. None of its Thai samples was collected for it.
Relationship to Austronesian groups
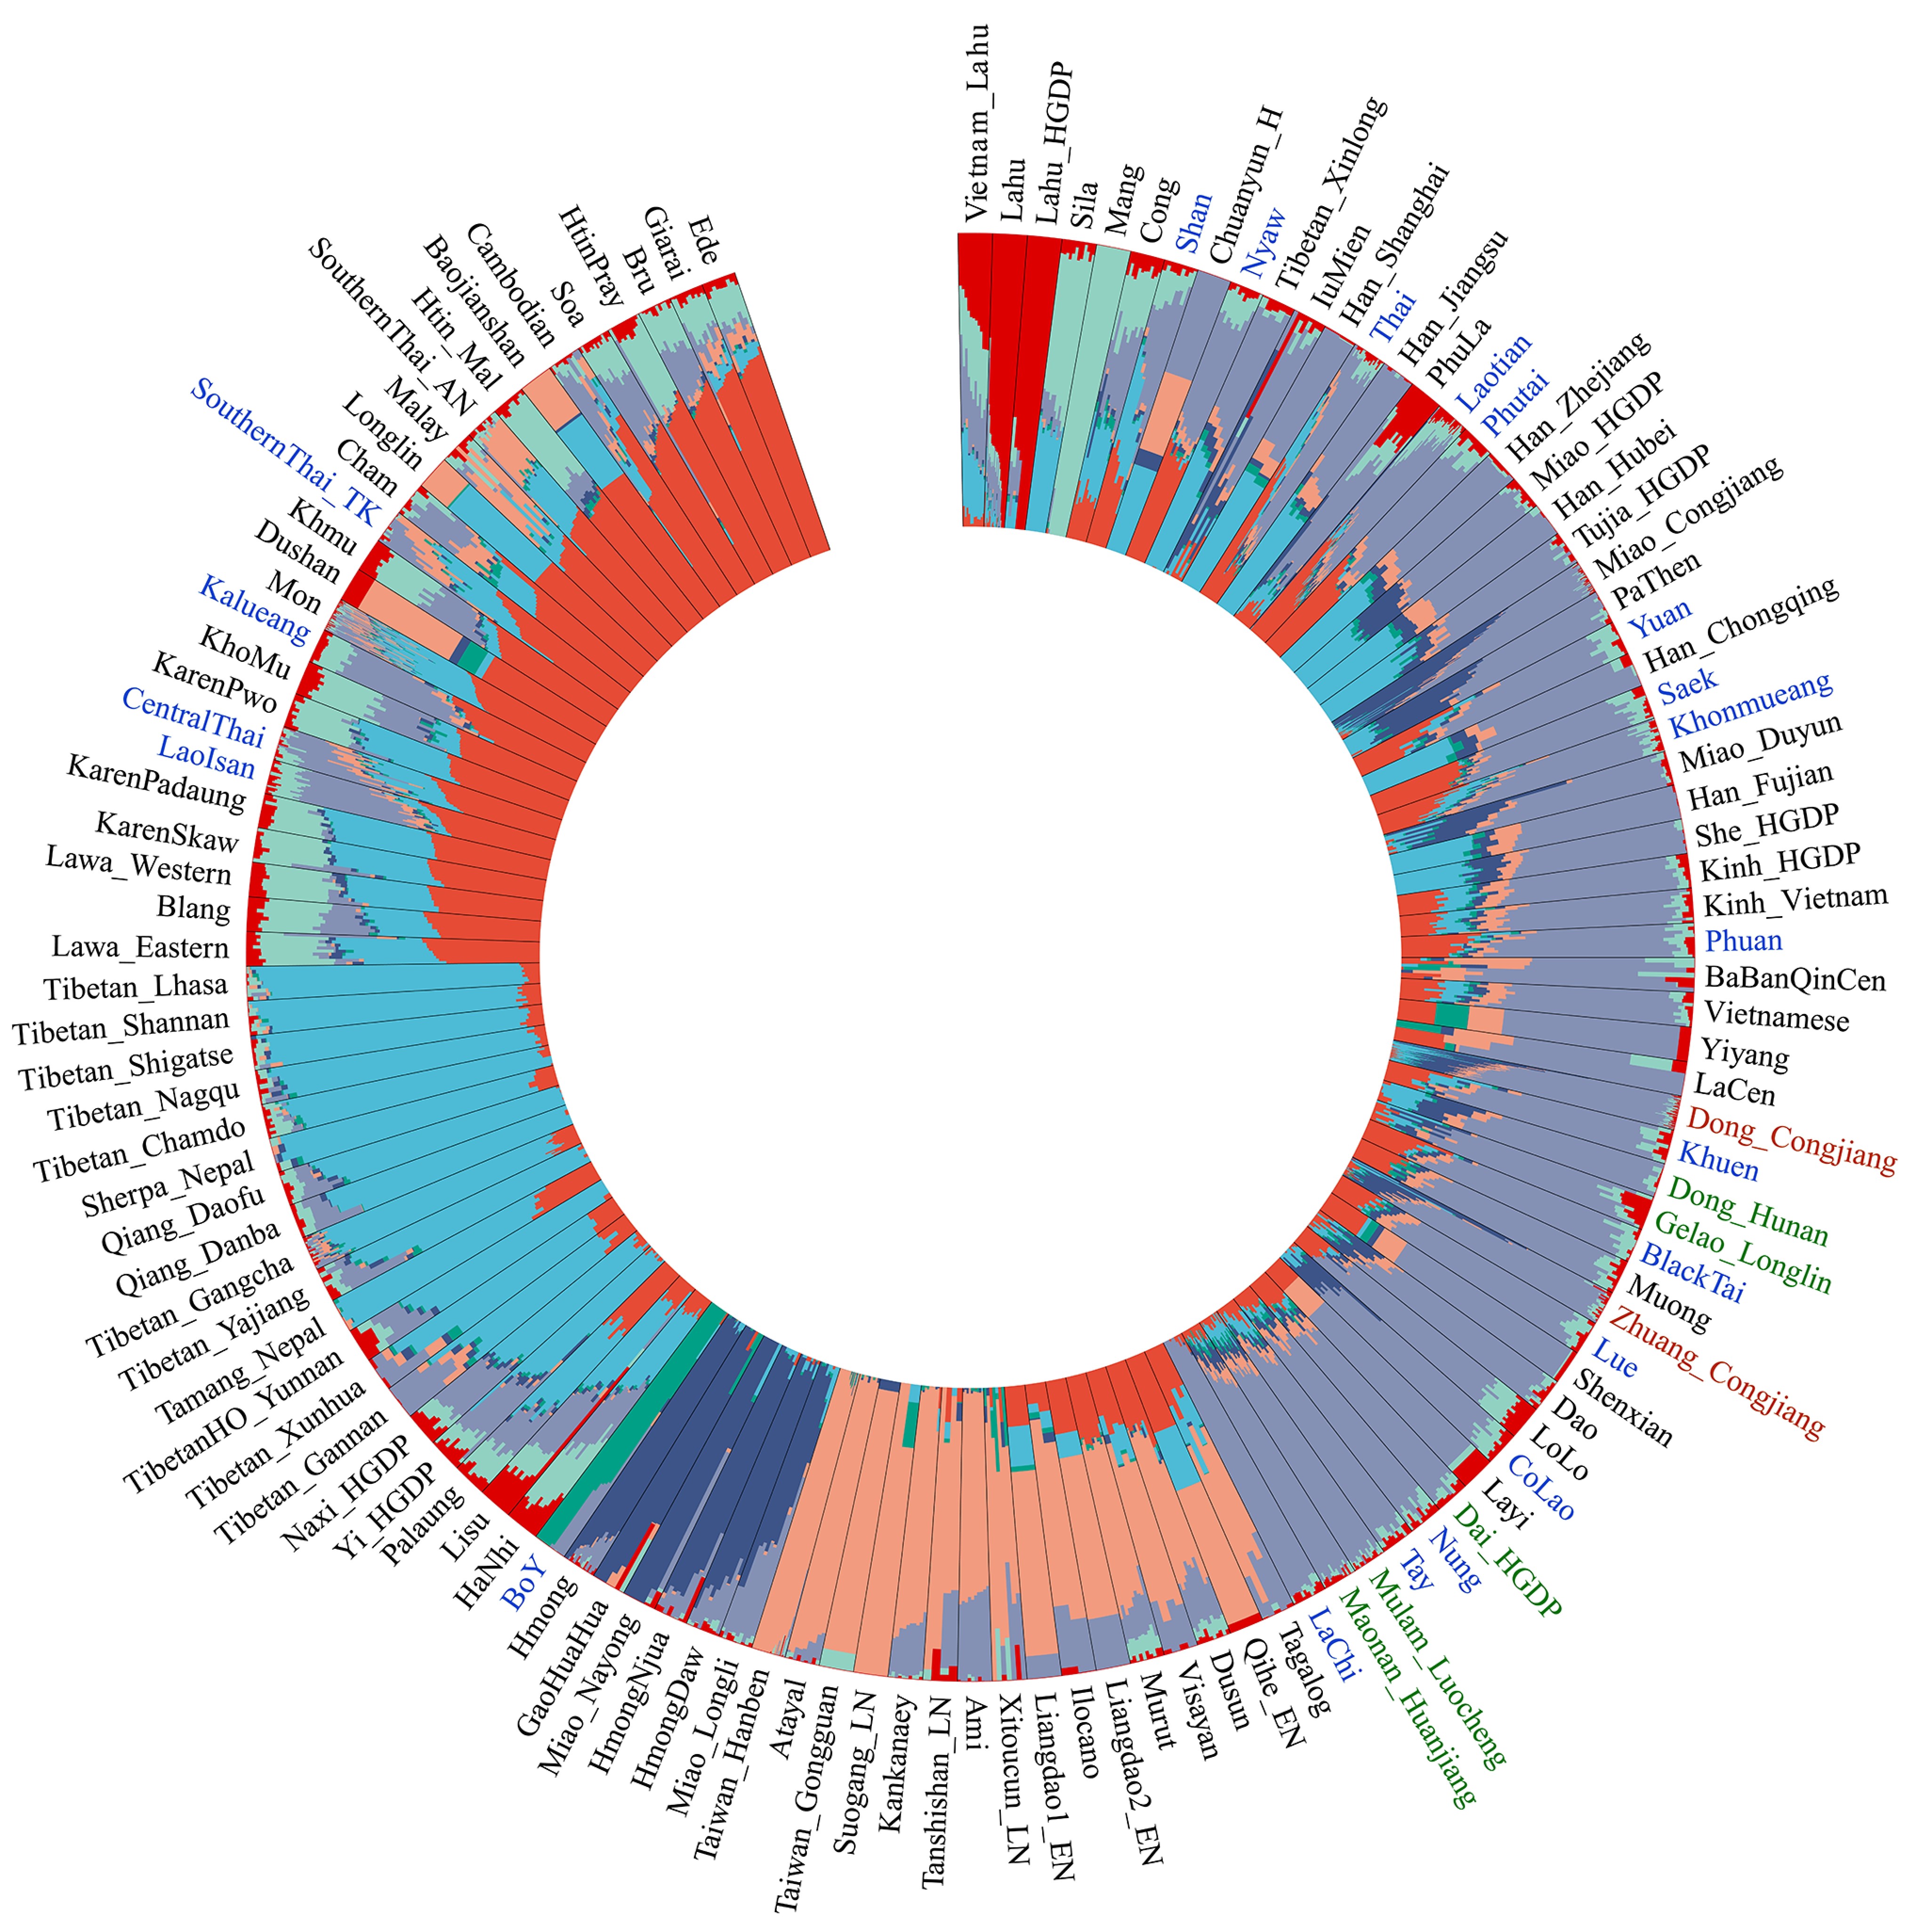
Genome-wide data from 77 people belonging to two Tai-Kadai-speaking groups in Guizhou in southern China, the Zhuang and the Dong, provide evidence relevant to the origins of the family's speakers. Among the populations compared, they are closest to the Austronesian-speaking Atayal and Paiwan of Taiwan. The study takes this similarity as support for a common origin of the two language families. In a two-source model, about half of their ancestry is attributed to millet farmers from the Yellow River valley in northern China and half to an indigenous Taiwan source associated with rice farming. A second version of the model gives the southern source a share of about 80 percent.
Atayal-related ancestry has also been estimated in dozens of Tai-Kadai-speaking populations in southern China and Vietnam, ranging from about 3 to 38 percent. The study interprets this shared ancestry as evidence of a deep relationship between the two language families. The Tai Lue sampled in the study are descended from people who reached Thailand from Myanmar within the last century. One test found that a single source was sufficient to model them, regardless of which of the three comparison populations was used. Another modelled them as a mixture of a Dai-related source and either a Mlabri-related source or a population that branched off before the Atayal.
Maternal genomes give a similar picture from a different line of evidence. Five possible branching histories for the four main language families of the region were tested against 1,794 sequences from Thailand and Laos. The two best-fitting histories both place Tai-Kadai and Austronesian on a common ancestral line. In the best-fitting history, the two separated in southeastern China about 5,000 to 6,000 years ago, followed by the spread of Tai-Kadai speakers through mainland Southeast Asia in the last 1,000 to 2,000 years. The authors stress that the analysis tests genetic relationships between populations, not relationships between languages, which require linguistic evidence.
The smaller and earlier study had reached a similar conclusion. Across 113 Asian populations, the Tai-Kadai-speaking samples fell between the Austroasiatic- and Austronesian-speaking populations. The authors attributed this closeness to a farming expansion that began in northern China between about 11,000 and 9,000 years ago. In their account, the expansion reached Taiwan as well as southern China and mainland Southeast Asia, giving the populations speaking the two families a common origin.
The paternal side has been examined through a single lineage. A revised tree of haplogroup O1a-M119 was built from 141 sequences, including 42 from Thailand. It contains sub-branches specific to Tai-Kadai speakers and others specific to Austronesian speakers, most of which expanded between about 6,000 and 4,500 years ago. The authors interpret this pattern as evidence of partial common ancestry. They also note that the branching pattern fits neither of the two usual accounts, in which Tai-Kadai is either a sister branch of Austronesian or a subgroup within it. The frequency data cover China only, and the Thai sequences were not included in the dating analysis.
Population routes into Thailand
 The earliest paternal survey to include men sampled in Thailand read seven positions on the Y chromosome in 610 men from 14 populations. Two of the fourteen were sampled in Thailand: 34 Thai from Khon Kaen and Chiang Mai, and 65 Khmer-speaking men whose province is not given. One of the eight profiles it distinguished accounts for 30 of the 34 and 55 of the 65, and for between 81 and 96 percent of the men in the Han Chinese, Malaysian and Philippine samples. Both samples from Thailand fall in one cluster with those populations. Another profile reaches 7 of the 65 Khmer-speaking men, the highest of the fourteen populations for that profile. The insertion that marks the lineage carried by more than a quarter of the men in every Japanese sample is otherwise almost absent from Asia. It appeared here in one man of the 34 and one of the 65. Its authors read the three commonest profiles across Asia as three separate movements of men into prehistoric east and southeast Asia. They date the mutations that define those profiles to between about 53,000 and 95,000 years ago, on an assumed constant population size and a 20-year generation.
The sampled southern Thai resemble East Asian reference populations more closely than the northern do. The study reporting this reads it as two separate routes: gene flow from Yunnan into northern Thailand, and a coastal route from Fujian and Guangdong through island Southeast Asia to the Malay Peninsula. The same authors connect the stronger South Asian component of the south to Austroasiatic-speaking populations moving along the coasts. That result sits beside, rather than against, the north-to-south decline in resemblance to the Tai-Kadai populations of southern China, because the two are measured against different reference populations.
The prominence of a Lao-related component in almost every Tai-Kadai group of Thailand has been read as movement through present-day Laos, with a second route into the north indicated by the Dai and Zhuang components found only there. The same authors set a documented alternative beside their own reading. Lao people were moved into Thailand in large numbers under King Taksin and again after the rebellion of King Anouvong, when about 150,000 were transported and roughly a third settled in the Chao Phraya basin.
Dispersal, assimilation, or admixture
Testing three models
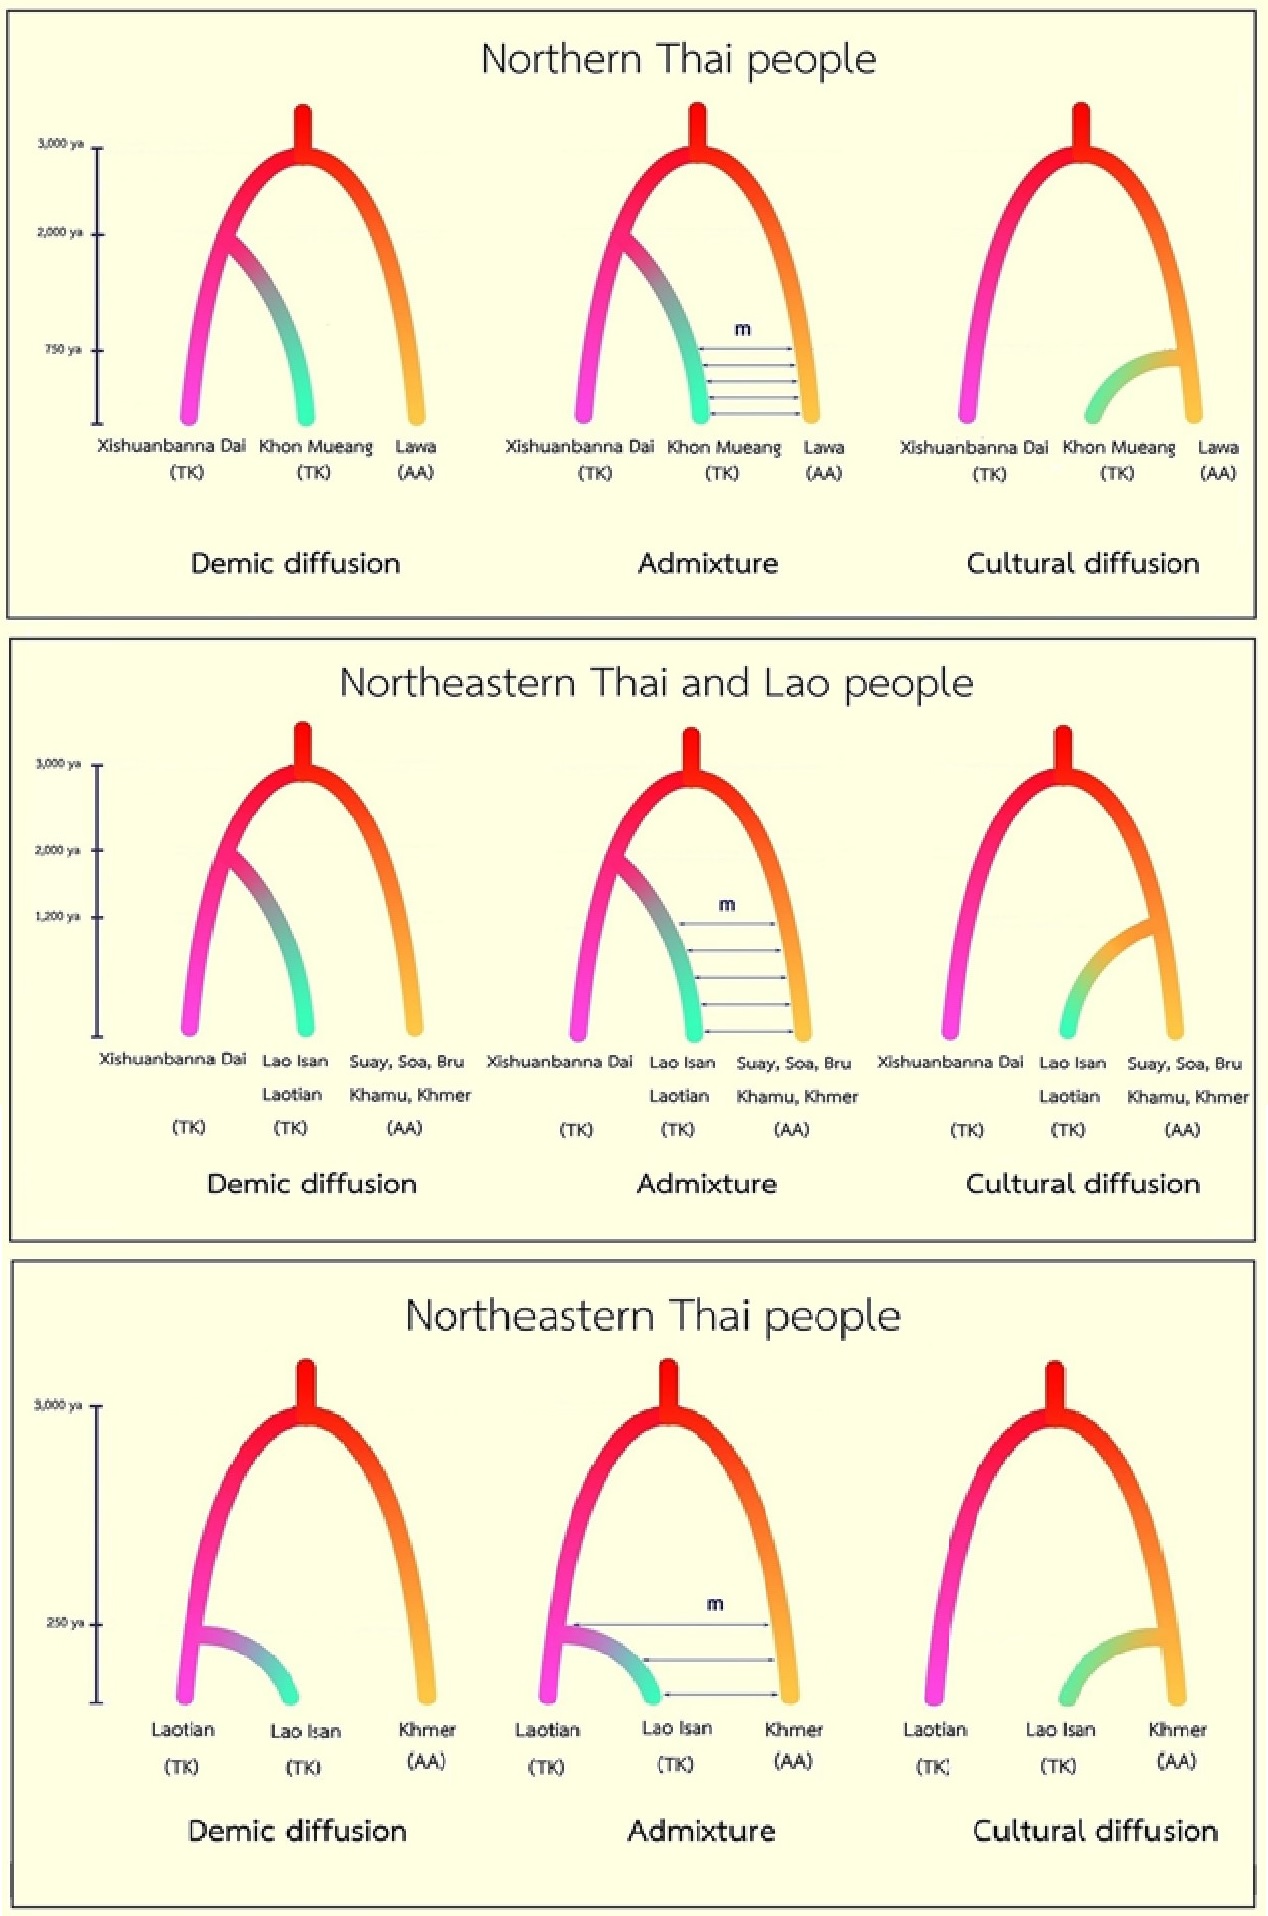
The question of how Tai-Kadai languages spread has long been debated: whether through the movement of their speakers, the adoption of the languages by neighbouring populations, or a combination of both. Complete maternal genomes from 51 populations in Thailand and Laos were used to test these three possibilities. Arrival from southern China was best supported for the northern Khon Mueang and ethnic Lao, while adoption alone was not supported for either group. For Lao Isan, considered separately, the test could not distinguish between arrival and a mixture of arrival and adoption.
The same three models were later tested for central Thai populations, which were not included in the earlier sample. Arrival was again the best supported model, chosen slightly more often than the mixed model and much more often than adoption alone. The authors interpret this as evidence that the population arrived with limited gene flow from the Mon and Khmer populations already present, while noting that their method could not clearly distinguish arrival from the mixed model. They also note that large numbers of central Thai were taken as captives to neighbouring kingdoms between about 500 and 300 years ago. The present population therefore cannot be assumed to descend solely from prehistoric Tai-Kadai groups.
The paternal-line results were less consistent with the maternal-line findings. The men sequenced for this analysis came from the same collection used for the earlier maternal genomes, so the two results do not represent separate population samples. Across five tests, arrival was best supported only for the northern Khon Mueang. For the central Thai, ethnic Lao and Laotian, the adoption model was preferred, although only weakly in each case. The authors attach little weight to this result. Their simulations reproduced the observed variation in only one of the five tests, leading them to conclude that the models did not adequately represent the paternal history. They also note that the male sequences may not contain enough information to distinguish between the three models. Measured by genetic distance instead, the Khon Mueang were closer to the Dai of southern China than to their Austroasiatic neighbours on both lines. The ethnic Lao were closer to the Dai on the maternal line and fell between the two on the paternal line, while the central Thai were closer to the Austroasiatic neighbours on the paternal line. The study suggests warfare as one possible explanation, since captives were taken in numbers between about 500 and 200 years ago, with men taken more often than women.
Evidence of interaction and admixture

Other genetic evidence points to interaction with earlier populations. Paternal lineages in the north favour a recent separation of the Khon Mueang from other Tai-Kadai populations. Central and southern groups carry mainly Austroasiatic-related ancestry while speaking Tai-Kadai and Austronesian languages, a pattern interpreted as evidence that these languages spread to, or mixed with, existing populations rather than replacing them. A reanalysis of the same genomes supports the arrival of Tai-Kadai speakers from southern China followed by admixture with local Austroasiatic-speaking populations. A similar contrast appears in maternal lineage frequencies among Tai-speaking populations.
Of the nineteen Tai-speaking populations compared, those sampled in Thailand and Cambodia, along with three from western Yunnan, fall closer to the Austroasiatic-speaking populations. Those from southern China and Myanmar, as well as one Phu Thai sample, do not. The study interprets this difference as the result of exchange with the Austroasiatic-speaking populations living around each group.
Ancient genomes provide another line of evidence for this interaction and its timing. A present-day Lao sample was modelled with about 47 percent of its ancestry coming from a group of populations that includes the Mlabri and the Nicobarese. It also carried a component that the study interprets as the result of mixing between resident Austroasiatic speakers and incoming Tai speakers in historical times. The authors add that the sample could not be modelled as a simple mixture of the two sources that account for the other two groups. A second ancient-genome project places the arrival of East Asian-related ancestry earlier. By about 2,000 years ago, the sampled populations across the region carried components of East Asian ancestry that were absent from the late Neolithic remains but present in present-day populations. The authors interpret one of these components as the introduction of ancestral Kra-Dai languages to mainland Southeast Asia, and another as the Austronesian expansion into the islands. They also report that the late Neolithic farmers share ancestry with present-day Austroasiatic-speaking highland groups.
The Lao Isan case illustrates why arrival and adoption can be difficult to distinguish. For one Lao Isan population in Buriram, two explanations were proposed without choosing between them: Lao speakers arrived and mixed with the Khmer already present, or the Khmer of Buriram adopted Lao speech and customs after Lao populations were moved into the region.
Alternative models
Not all evidence supports an arrival model. A craniometric study published in 1994 found modern Thai crania closer to those from archaeological sites in Thailand than to Neolithic Chinese crania. Its author concluded that neither the arrival model nor local continuity alone explained the findings. An earlier study of northern populations likewise proposed two possibilities: that incoming Tai-speaking and resident Austroasiatic-speaking populations were already genetically similar, or that gene flow followed the Tai arrival. Its authors considered the former unlikely because of the cultural differences between the two populations.
Boundaries between groups
The question of whether the boundaries between these populations are still holding has also been raised. A component associated with the Karen, who reached northern Thailand in recent decades, is now detectable in both the Austroasiatic and Tai-speaking populations there. The study reporting this reads it as a sign that language, culture and distance are becoming less effective as barriers to marriage between groups. Its authors expect that samples representing distinct ethnic groups in the region will soon be difficult to recruit.
Regional population structure

Genetic differences between the four regions are slight, and follow a gradient rather than a clear boundary. The further south a Tai-Kadai-speaking population lies, the less it resembles the Tai-Kadai populations of southern China.
Among Tai-Kadai speakers, the differences are smaller still. Across eighteen sampled populations in three regions, the average difference between any two is very small, about two fifths of that between the Austroasiatic-speaking populations of the north. Sorting the eighteen populations by region explains none of the variation, while a clustering method run with between two and twelve groups found no clear structure dividing them.
The differentiation that does exist is unevenly distributed. Populations sampled in the northeast differ from one another more than the average, those in the centre less, and those in the north least of all.
Across mainland Southeast Asia as a whole, the differences are larger. Populations in the region differ from one another more than East Asian populations spread over a comparable distance do.
A separate approach reaches a similar conclusion. Among 374 people recruited for a study of depression and grouped by the region they identified with, the four regions formed a single homogeneous pattern when examined on their own. Markers chosen specifically to distinguish the regions separated northern from southern samples only after the central and northeastern samples were set aside. A marker set large enough to separate the whole Thai sample from other Asian populations could not divide it internally at all.
Using markers selected to distinguish north from south, the sampled northern and southern Thai differ from each other about as much as either does from a Han Chinese reference. The northern samples, however, are further from both Han Chinese and Japanese references than the southern samples are.
The maternal line gives a similar picture. Complete mitochondrial genomes were obtained from 166 people recorded as Thai on their identity cards and grouped by the six administrative regions used by the government. Differences between those regions account for 0.4 percent of the variation and are not statistically significant. The 166 samples contained 164 distinct sequences belonging to 97 maternal lineages, twenty of which had not been reported before. A larger survey analysed complete genomes from 1,234 people in 51 populations of Thailand and Laos, finding 761 distinct sequences in 212 lineages. Extending the survey to 1,794 genomes from 73 populations raised the totals to 1,103 sequences in 274 lineages, 62 of them absent from the earlier set. The four commonest were F1 at 21.8 percent, B5 at 13.1 percent, M7 at 11.0 percent and B4 at 6.0 percent, all widespread in Southeast Asia. Sorting the 51 populations into four Thai regions, or five with Laos added, accounts for 0.36 percent and 0.07 percent of the variation, respectively. Populations within a region differ by about 7.7 percent, and people within a population account for the remaining 92 percent.
Northern Thailand

Northern Tai-Kadai populations resemble populations in southern China and Vietnam more closely than they do Tai-Kadai populations elsewhere in Thailand. Their closest single match is a source related to the Dai of southern China. The Shan are an exception, resembling instead their Tibetan, Karen and Lawa neighbours. A component matching the Zhuang of southern China accounts for as much as 41 percent of the recent ancestry of most northern Tai-Kadai groups. It occurs together with a Dai-related component only in these groups and in one central population that came from the north.
Khon Mueang
The term Khon Mueang refers to a social and political category rather than a single group. Its largest component is the Yuan, but Austroasiatic-speaking and other Tai-speaking populations of the region have also contributed to it.
Ten Khon Mueang villages along the route the Yuan are recorded as taking from Chiang Rai to Lampang were studied on both parental lines, 433 people in all. Among the 204 men, 193 distinct paternal profiles were found, 184 of them carried by one man each. On the father's line, the ten villages differ little, with two exceptions: one village in the Mae Cham basin, off the route, and one in Lampang. The study connects the first to the highland populations around Mae Cham and the second to the Mon who occupied the Lampang region before the Yuan reached it.
On the mother's line, the grouping is different. The villages of the Chiang Mai and Lamphun basin fall together, those of Chiang Rai, Mae Cham and one in Lampang form a second group, and the remaining Lampang village sits apart from both. That village is recorded as having moved from Chiang Saen about 200 years earlier. The study attributes its distinct maternal profile to a small founding group and to women having moved less than men. Most of the basin villages show signs of past population growth, which the study reads as expansion and exchange within the basin after settlement at the end of the thirteenth century. The two lines do not track each other across the ten villages at all.
Fifteen repeated sequences were typed in 436 Khon Mueang from those ten villages and in 507 people from seven neighbouring groups. Each village was then modelled as a mixture of two parental sets, one Austroasiatic-speaking and one Tai-speaking. Every village has a share from both, and in eight of the ten the Tai share is larger. The Austroasiatic share ranges from about 19 percent in one Chiang Mai village to about 60 percent in another. The standard deviations given with those proportions are as large as some of the proportions themselves. All but one of the villages fall in the middle of the comparison among the Tai-speaking populations, which the study interprets as an admixed origin.
Villages in the same basin differ from one another, which the study reads as wide variation among the Khon Mueang and as an effect of when each village was formed rather than where it lies. It connects gene flow from Tai-speaking populations more to the mass movements of about 1800 than to those of about 1300. The Lampang village with the largest Mon share lies where the Mon ruled between 750 and 1300, while the one with the largest Lawa share is recorded as having come from Chiang Saen within the previous 200 years. For the village off the migration route, the authors say the estimate may not be reliable because the highland populations around it that could have been sources were not sampled.
Other northern Tai-Kadai populations
The Yuan of Uttaradit carry the widest variation of any Tai-Kadai population sampled in the country and show evidence of substantial gene flow. The study connects this to the province lying between the northern and central Thai language areas. Four sampled Lue villages differ noticeably from one another, especially those in Nan, and the difference is attributed to descent from small founding groups. The Lue of Chiang Rai and Chiang Mai remain close to the Yuan, while the are close to the Lue. The Shan, who entered the northern mountains around 1400, are closest not to their northern neighbours but to Tai-speaking populations of the Sakon Nakhon basin in the northeast.
The Phuan sampled in Sukhothai are recorded as having come from Muang Phuan in Xiangkhouang, and as having been moved south under a Siamese depopulation policy in the late eighteenth and early nineteenth centuries. They differ only weakly from the other Tai-Kadai populations compared. The study reads this as gene flow from Austroasiatic neighbours together with little marriage into other Tai-Kadai groups.
The of Lamphun, whose largest movement south is dated to 1805, were sampled as 111 men from six villages. Two lineages account for most of them, O-M268 in 47 and O-M122 in 41. On the mother's line, the Yong had been found to descend from the Dai of Xishuangbanna, consistent with their documented founding by Dai settlers. On the father's line, they do not. Their closest matches among Tai-Kadai populations are the Zhuang, the Bouyei and the Shan. The same study finds no sign of mixing between the Yong and the Lawa, who held the area first. The two share no Y-chromosome profile, and the founding Lawa lineage had separated from the Yong about 2,900 years ago, well before the Yong arrived.
The Yong and the Lue descend from the same Dai population of Xishuangbanna, but no longer resemble one another on the mother's line. Differences between six Yong villages account for about 2 percent of the maternal variation among them, and differences between four Lue villages for about 5 percent. The Yong group with sampled Dai populations of Yunnan, while the Lue scatter away from both. Neither group differs significantly from the Dai, although the two differ from each other. Maternal population size falls sharply in every sampled Lue village about 1,000 to 2,000 years ago. The study reads the Lue villages as small founding groups that became separated from one another by hill country. It sees the Yong as less affected by this because of the size of their move, about 10,000 people in 1805, and because all their villages lie in one basin.
One sampled Lue village is the exception on every measure. It has a steady maternal population size and groups with the Yong and the Dai rather than with the other Lue. Its villagers told the authors that they had come directly from Jinghong in Xishuangbanna within the previous hundred years.
Population sizes across the northern Tai-Kadai groups fell sharply about 250 to 300 years ago, most steeply among the Lue and Khuen, and the mixing that can be dated in them is equally recent. Both match the resettlement campaigns of King Kawila of Lan Na in the late eighteenth and early nineteenth centuries, which moved Lue, Yong and Khuen communities from Xishuangbanna and the Shan State into Chiang Mai, Lampang and Lamphun.
The earliest survey of these groups examined a short stretch of the maternal molecule in 496 people from ten villages of Yuan, Lue, Yong and Khuen. Villages sharing an ethnic name did not group together there either. None of the four Lue villages was close to the others, the Yong of Lamphun sat nearest a Lue village in Chiang Rai, and the Yuan of Saraburi sat apart from the Yuan of the north. The authors read each village as shaped by the small group that founded it, by chance changes afterwards, and by women having moved little between villages. Of the ten, the two Yuan villages of Chiang Mai were closest to the Zhuang of Guangxi, and the Dai of Yunnan also showed a relationship to them. The study read this as support for an ancestral source among the Tai groups of southern or southeastern China.
Variation between northern villages

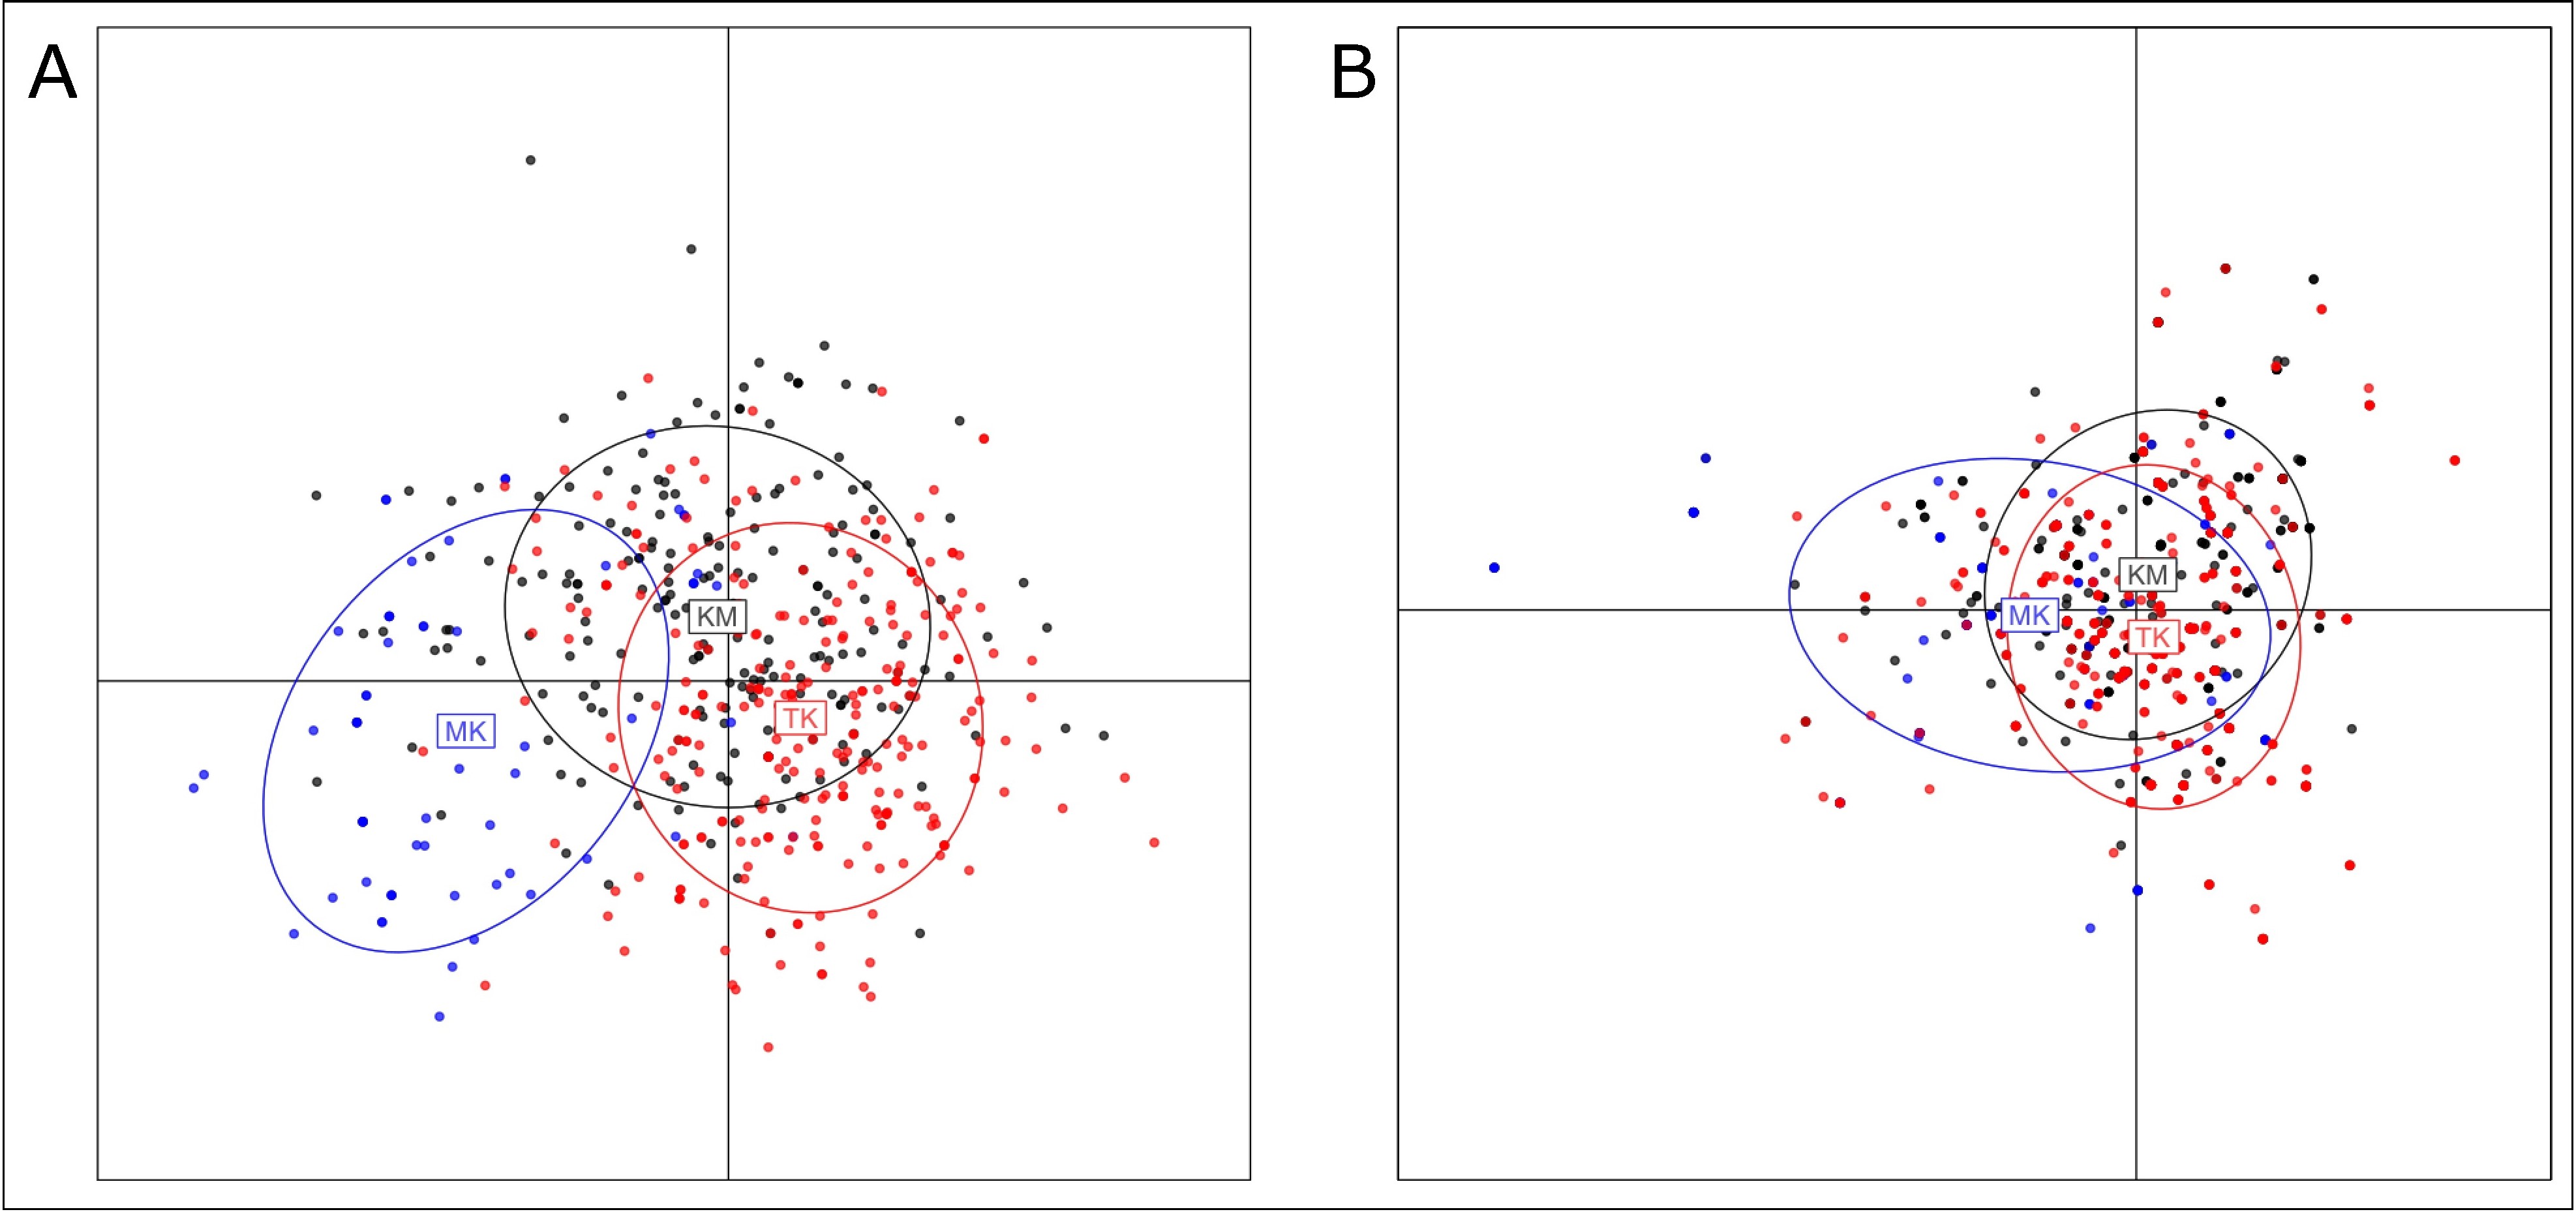
A survey of 190 men from rural villages across Chiang Mai province found 145 distinct maternal sequences among the sample. The commonest lineages were F1a in 18 of the 190, F1a1a in 15 and M7b1 in 13, while C, G, A and Z each accounted for under 3 percent. Five lineages within haplogroups M and N had not been described before. The sample carried a wider range of maternal sequences than any other Thai sample compared with it, and about a fifth of its sequences occur in one or more of those samples. Differences between the Thai samples accounted for 5 percent of the variation, and they differed significantly from one another even though all were drawn from the same part of the country. The study attributes this to settled farming or partly nomadic ways of life and to different social structures. One lineage, F1a1a, was found in the Thai samples and in none of the surrounding Asian populations compared.
Villages of Austroasiatic speakers differ far more from one another than Tai-Kadai villages do. The difference is greater on the father's line than on the mother's. Measured across repeated sequences at fifteen positions, differences between populations account for about 6 percent of the variation among the Austroasiatic groups. The figure is about 2 percent among the Karen and well under 1 percent among the Tai. Every pair of Austroasiatic populations tested differed significantly; only four of thirty-six Tai pairs did. The two Lawa villages sampled are the extreme case. Each carries only four of the 23 haplogroups found in the region. A haplogroup common in most other villages appears in a single man out of 25 in one of them, and the sharpest break in gene flow anywhere in the survey lies between the two. Two H'tin villages show a similarly narrow range of maternal lines, which the study connects to their resettlement into Nan province some 70 to 90 years earlier.
Even the commonest paternal lineage varies widely between villages: O-PK4 is present in all 24 villages sampled, but in 2 of 26 men among the and 18 of 25 in one Lawa village. Among the sampled Mon, 3 of 18 men carry a lineage usually found in South, Central and West Asia, which the study reads as evidence of a connection to South Asia followed by later mixing with Tai populations.
The Austroasiatic populations of the north fall into two groups. One study reads this division as reflecting differences in their contact with Tai populations. The Khmu, Lua, Palaung and Htin, who live in more remote areas, form a group apart from the Tai-speaking populations. The Lawa and the Mon, named in inscriptions of 1218 and 1219 as inhabitants of the Chiang Mai and Lamphun basin, fall among them.
The Karen, who arrived in the region more recently, are closer to the Tai populations than any other Austroasiatic group, and a Karen component occurs in both. The Tai-speaking populations themselves differ very little from one another.
Northeastern Thailand

Northeastern populations form a distinguishable group whose closest matches lie across the Mekong. They resemble Austroasiatic-speaking peoples such as the Khmu and the Bru, as well as Lao populations. In two of the sampled groups, a Lao-related source accounts for all the ancestry that could be assigned in the model. One group, the Black Tai, instead matches a Tai population in Vietnam, with about a seventh of its recent ancestry tracing to such a source. A Lao-related component reaches 95 percent in Tai-Kadai groups sampled near the Lao border, while the Austroasiatic-speaking Bru from the same region carry less than 1 percent.
Of eight populations compared in an early survey of the maternal molecule, the sample of 44 from Khon Kaen shared sequence types with more of the others than any other population did. The authors therefore regarded the northeast as a centre of dispersal in the country. The Khon Kaen sample and 25 Phu Thai from Mukdahan were almost indistinguishable on the same measure.
Lao Isan

In one village in Buriram province, 53 people were typed at fifteen repeated sequences and modelled using only their neighbouring populations, since comparable data from Laos had not yet been published. On that restricted set of sources, about 65 percent of their ancestry came from two Tai-Kadai-speaking groups, the Nyo and the Kaleung, and about 35 percent from three Austroasiatic-speaking groups, the Khmer, Kuy and Nyah Kur. A Lao Isan sample from Roi Et showed the opposite pattern, with about 58 percent from the Austroasiatic sources. The standard deviations given beside these proportions are as large as some of the proportions themselves. Two of the seven neighbouring populations tested first, the Phu Thai and the So, returned negative values and were excluded as sources. The authors note that the result does not fit the archaeological evidence for a long Khmer presence in Buriram. They suggest that the Khmer comparison sample, which came from another province, may not represent the Khmer population of Buriram.
A survey of fifteen repeated sequences covered six Lao Isan populations, two Lao populations in Laos and six Austroasiatic-speaking populations from the same provinces. Most Lao Isan ancestry traces to a Lao source, with between about a tenth and a half coming from an Austroasiatic source. The Austroasiatic source varies between Lao Isan populations. The Khmer and Nyah Kur are the largest contributors overall, while three of the six also have a contribution from the neighbouring So. The study reads this variation as evidence of local histories not recorded in written sources. Of the two Lao populations, the one at Vientiane is closer to the Lao Isan populations than the one at Luang Prabang, although the two Lao populations do not differ significantly from each other. Differences among the six Lao Isan populations account for less than 1 percent of the variation within them.
A later study using 23 repeated sequences, largely from DNA in the collections used for that survey, covered seven Lao Isan populations and three in Laos. The seven Lao Isan populations differ little from one another or from the Tai-Kadai-speaking Laotians of Luang Prabang and Vientiane. The samples from Loei and Chaiyaphum, together with one of the two samples from Ubon Ratchathani, stand apart from the others. The second Ubon Ratchathani sample, by contrast, is close to all the other ethnic Lao populations. The Austroasiatic-speaking Laotians of Savannakhet in southern Laos are closer to the Lao Isan of Ubon Ratchathani across the river than to either of the Tai-Kadai-speaking Laotian populations.
Saek people
One northeastern population stands apart from all the others. The Saek carry the narrowest range of variation of any Tai-Kadai population sampled, differ significantly from every other population, and are the first to separate out under every method used in the study. The authors attribute this to descent from a small founding group, possibly within the last 200 years, during a movement from Vietnam through Laos and across the Mekong. The Saek language is also the only one in the study outside the Southwestern branch of Tai. A later study of 100 Tai-Kadai languages reaches the same placement by a different method, putting Saek in the Northern branch of Tai. Its own tree instead places Saek beside the Southwestern branch, which the authors attribute to about 37 percent of its related word forms having been borrowed from Southwestern Tai neighbours.
In the largest survey of maternal lineages, the Saek are again one of three populations furthest from the rest. On a shorter stretch of the same molecule, they are the most differentiated of ten northeastern groups and have the least maternal variation among them. The authors attribute this to chance changes during settlement by a small number of women. Their closest match is not another Tai-Kadai group but the Austroasiatic-speaking So of the same basin, although the study notes that this does not match the linguistic classification of Saek. It adds that the geographic factor may be obscuring their ancestry.
Austroasiatic-speaking populations
Two Northern Khmer-speaking populations sampled in the northeast differ genetically from each other and from Khmer speakers sampled in Cambodia, although they are geographically close and share maternal lineages. A Lao Isan sample from Roi Et and a Khmer sample from Surin do not differ significantly on the maternal line, which the study reads as evidence of extensive gene flow between them. The Suay or Kuy people of Surin are also close to the Khmer on the same measure and do not differ significantly from the Nyah Kur. On the paternal line, a Khmer sample of 20 men from the northeast is the most distant of the Thai populations compared, which the study attributes to a small population and chance changes in allele frequencies.
Central Thailand
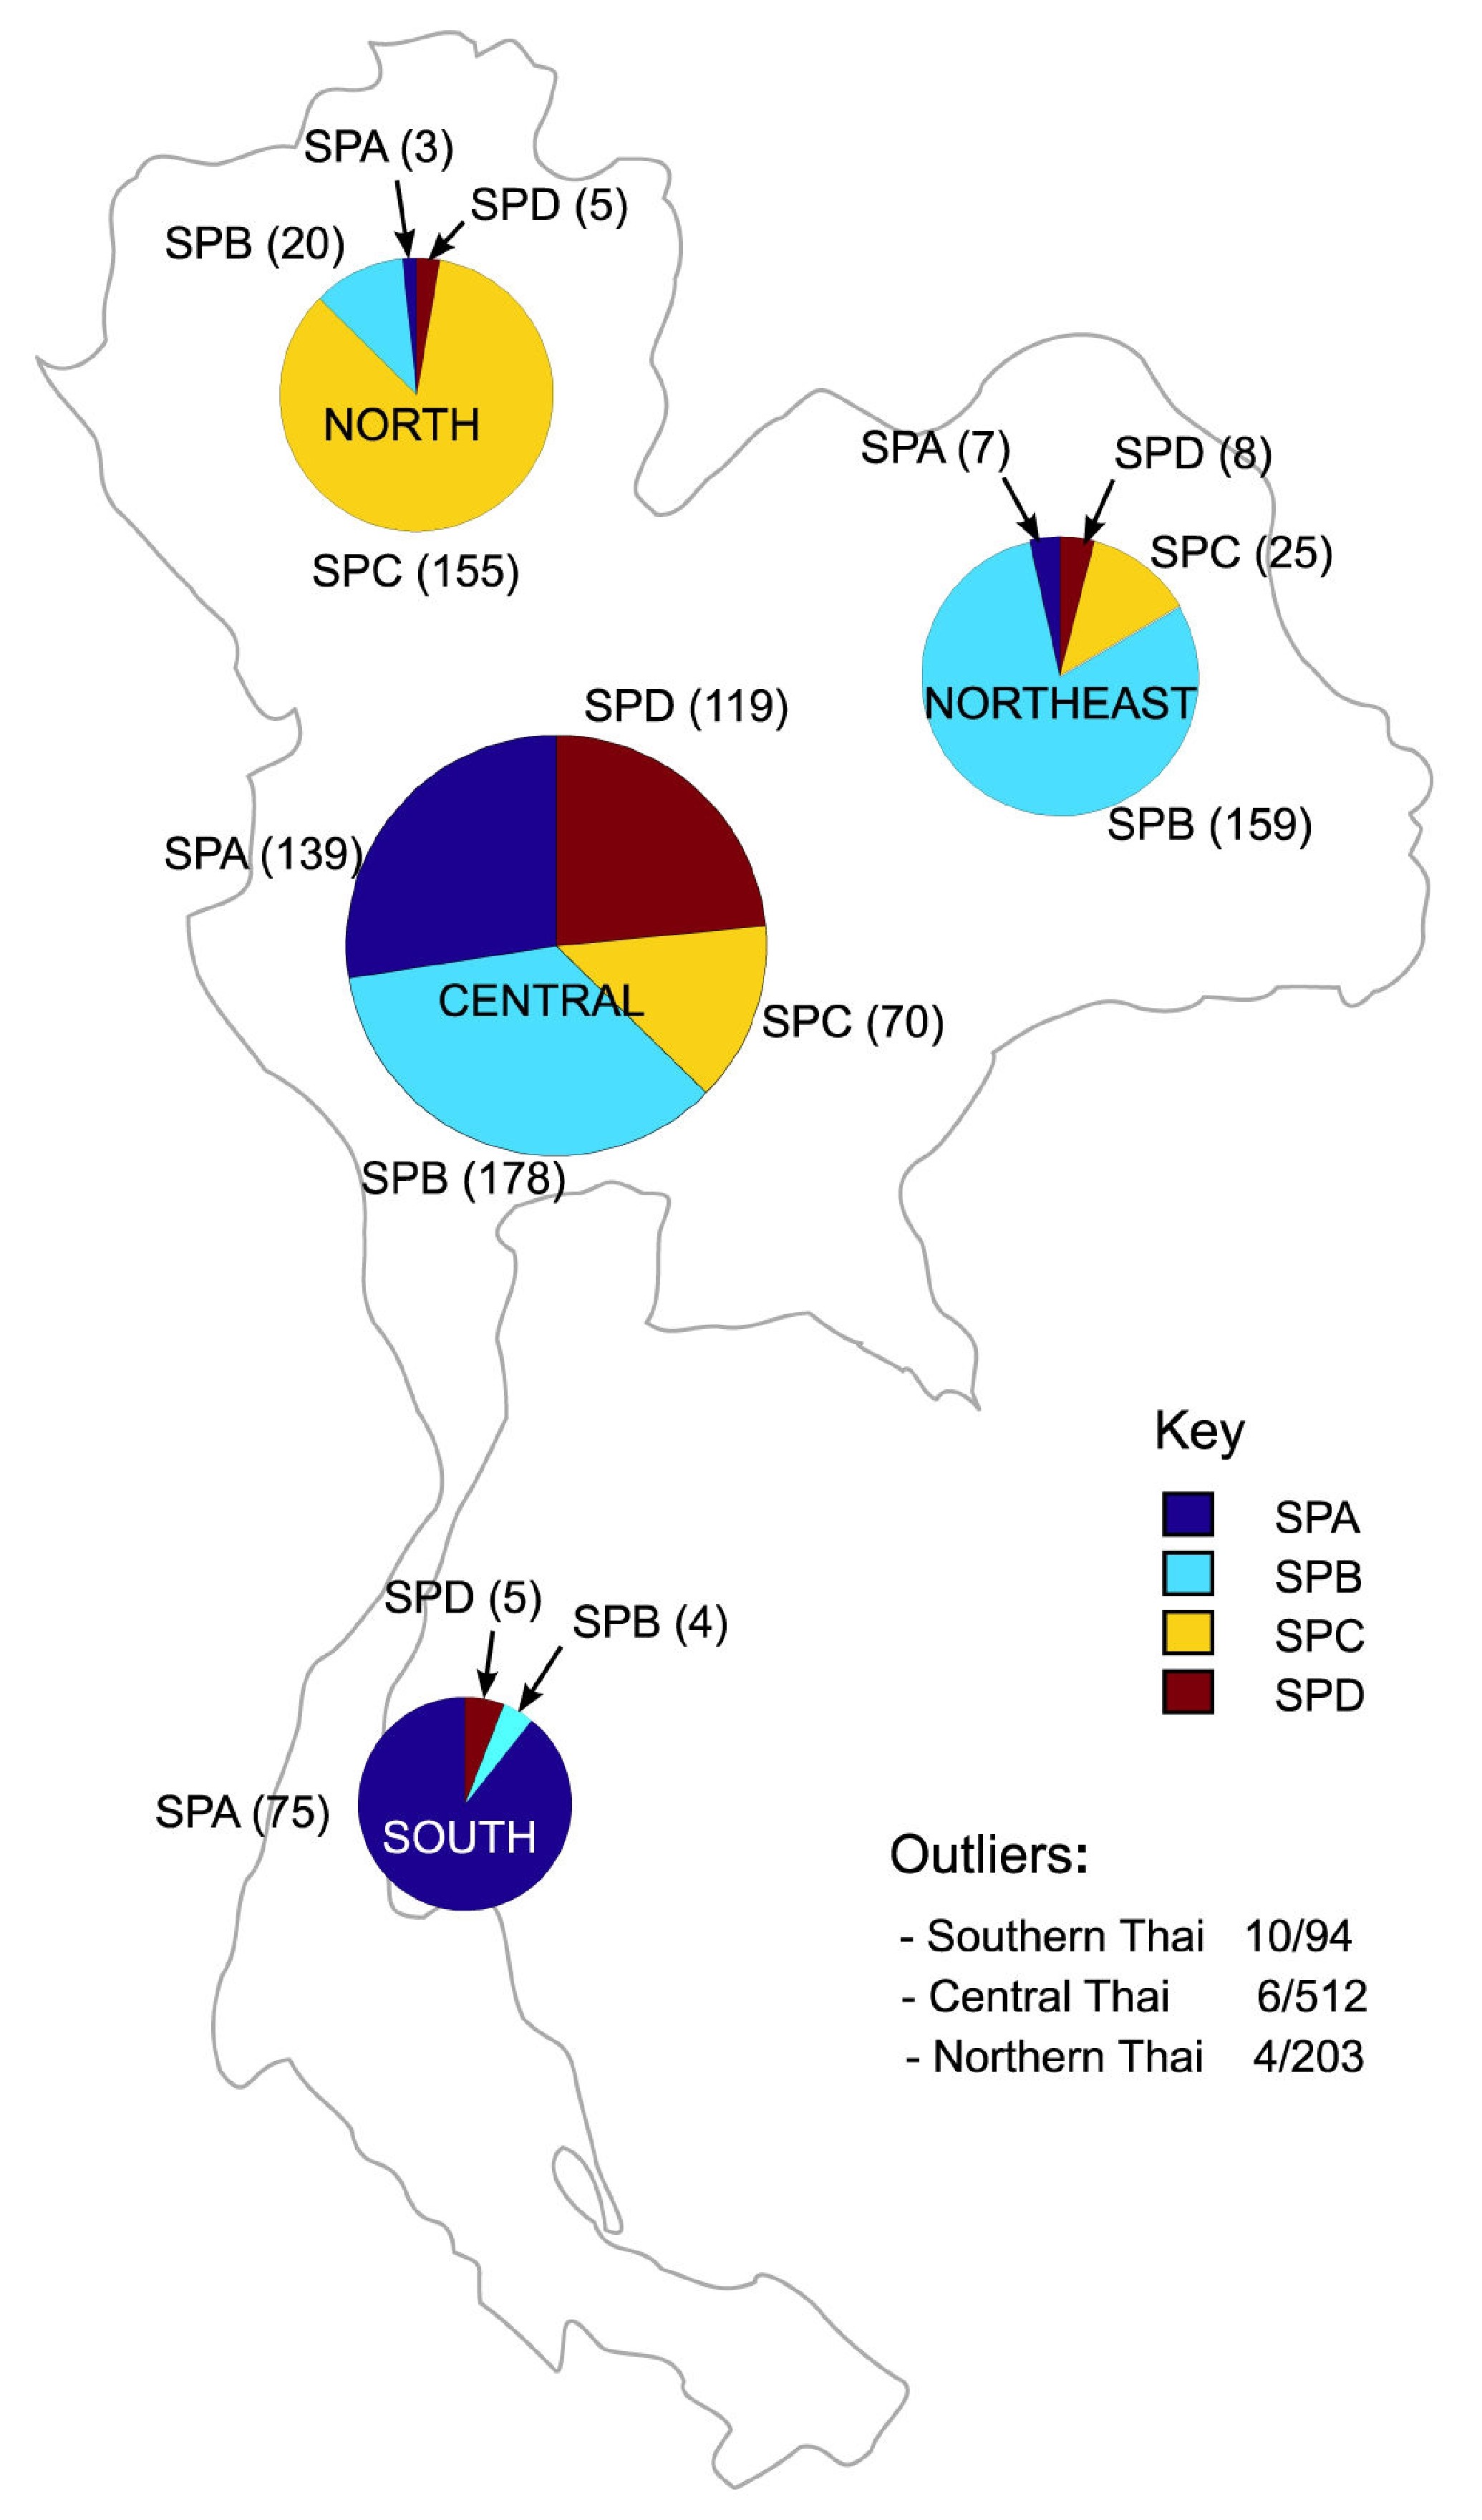
The central region is the most internally varied of the four, with no single group making up a majority. More than half the ancestry of its Tai-Kadai populations comes from sources outside the Tai-Kadai world, including one related to the Indian subcontinent. The population diversity of the region is also reflected in an ancient Chinese account of Tun Sun, a polity said to have extended across parts of present-day central and southern Thailand, which mentions more than 1,000 Brahmins from South Asia, about 500 families described as Hu (), about 200 Fo-t'u, and local people living there in the 3rd century. Briggs associates Tun Sun with the Mon, who are also the closest genetic match to the central Thai among the sampled populations. Earlier, Khao Sam Kaeo, near the Kra Isthmus, had developed as a large Indian-style settlement between the 4th and 2nd centuries BCE and functioned as a port between the Indian Ocean and South China Sea.
When the ancestry of 26 populations was divided into three components, the sampled central Thai and Mon had two of them in near-equal shares. One is concentrated in northern Thailand, at 30 to 56 percent, and the other in the northeast, at 30 to 55 percent. The third, also found in an Indian sample, accounts for 10 to 30 percent in both groups. When each sampled central Thai population was modelled as a mixture of Mon, Khmer and Tai sources, most received more than 62 percent from the Mon source. In a tree of Asian populations, they fall near Lao, Yuan, Vietnamese and Mon samples.
More than half the recent ancestry of the central Tai-Kadai populations traces to a Lao-related source, and about a quarter to a source related to the Bamar of Myanmar.
On the maternal line, the seven central Thai populations sampled show a wide range of lineages, most occurring at less than 10 percent within any one population. Several lineages that branch deep in the maternal tree were found in these populations and in no other Thai or Lao group sampled. They share maternal sequences more often with northeastern than with northern populations.
Two of the sampled central Thai populations stand apart because they share an unusual amount of their genome with the Mon, and both come from Photharam district in Ratchaburi. The province was home to a major city of the Mon-speaking Dvaravati state and remains a centre of the Mon population today. Other central Thai samples from the same district do not show the same pattern.
Resettled populations
One population there carries a documented history in its genetics. Royal policy moved the Yuan south from Chiang Saen into Uttaradit, Saraburi and Ratchaburi in the early 1800s. Generations later, they still resemble populations from the far northwest. They retain about a tenth of the Zhuang-related component otherwise confined to the north. Yuan sampled in Uttaradit, Saraburi and Ratchaburi still resemble those of Chiang Mai two centuries after the move, which the study attributes partly to their having lived apart from the surrounding Thai population. In a study using fifteen repeated sequences, the 43 people sampled at Sao Hai in Saraburi differ significantly from all three Austroasiatic-speaking populations compared. They do not differ significantly from one northern Yuan sample, one Lue sample or five Khon Mueang villages. When divided into seven components, about 78 percent of their ancestry falls in components common among the Tai-speaking populations and about 22 percent in components concentrated among the Austroasiatic-speaking ones. The study reads two centuries as too short for substantial mixing with the surrounding population to appear, and notes that no comparable data for central Thai populations were then available.
The Black Tai, moved to Phetchaburi in the 19th century from the country west of the Black River near Dien Bien Phu in Vietnam, are close to both the Yuan and the Lao. On the maternal line, an earlier study places the Lao Song of central Thailand, recorded there as descendants of Black Tai moved from northwestern Vietnam, near the Austroasiatic-speaking Chong and well away from the Khmer. Its authors connect this to accounts that Black Tai in their homeland took in Austroasiatic neighbours before any reached Thailand. The same pairing was reported seven years earlier, using sequences later reused by that study. A sample of 25 Lao Song from Suphan Buri and 25 Chong from Chanthaburi were closer to each other than either was to any of six other Thai populations. The result conflicts with the recorded account that the Lao Song and the Phu Thai left the same homeland at different times, and the study reporting it notes this discrepancy.
Tak province
In Tak province, on the Myanmar border, 274 men holding Thai identity cards were tested for a fixed set of Y-chromosome mutations. Two lineages account for most of the sample: O-M133 in 122 of the 274 men and O-M95 in 58. A third result, found in 39 men, is reported by the authors as probably an unresolved branch of haplogroup N, since the marker used to identify N was not included in the test. O-M133 is also common among the Dai of Yunnan, which the study considers alongside the southern Chinese affinities reported for Tai-Kadai-speaking populations.
The same study places the Tak sample closest to the Karen among the populations compared, and notes that Tak shares with three Karen groups an unusually narrow range of variation at one repeat marker. The two commonest lineages are estimated to have last shared a common ancestor about 4,600 and 5,400 years ago, although the authors note that a public reference database gives a much older range for the latter.
Southern Thailand
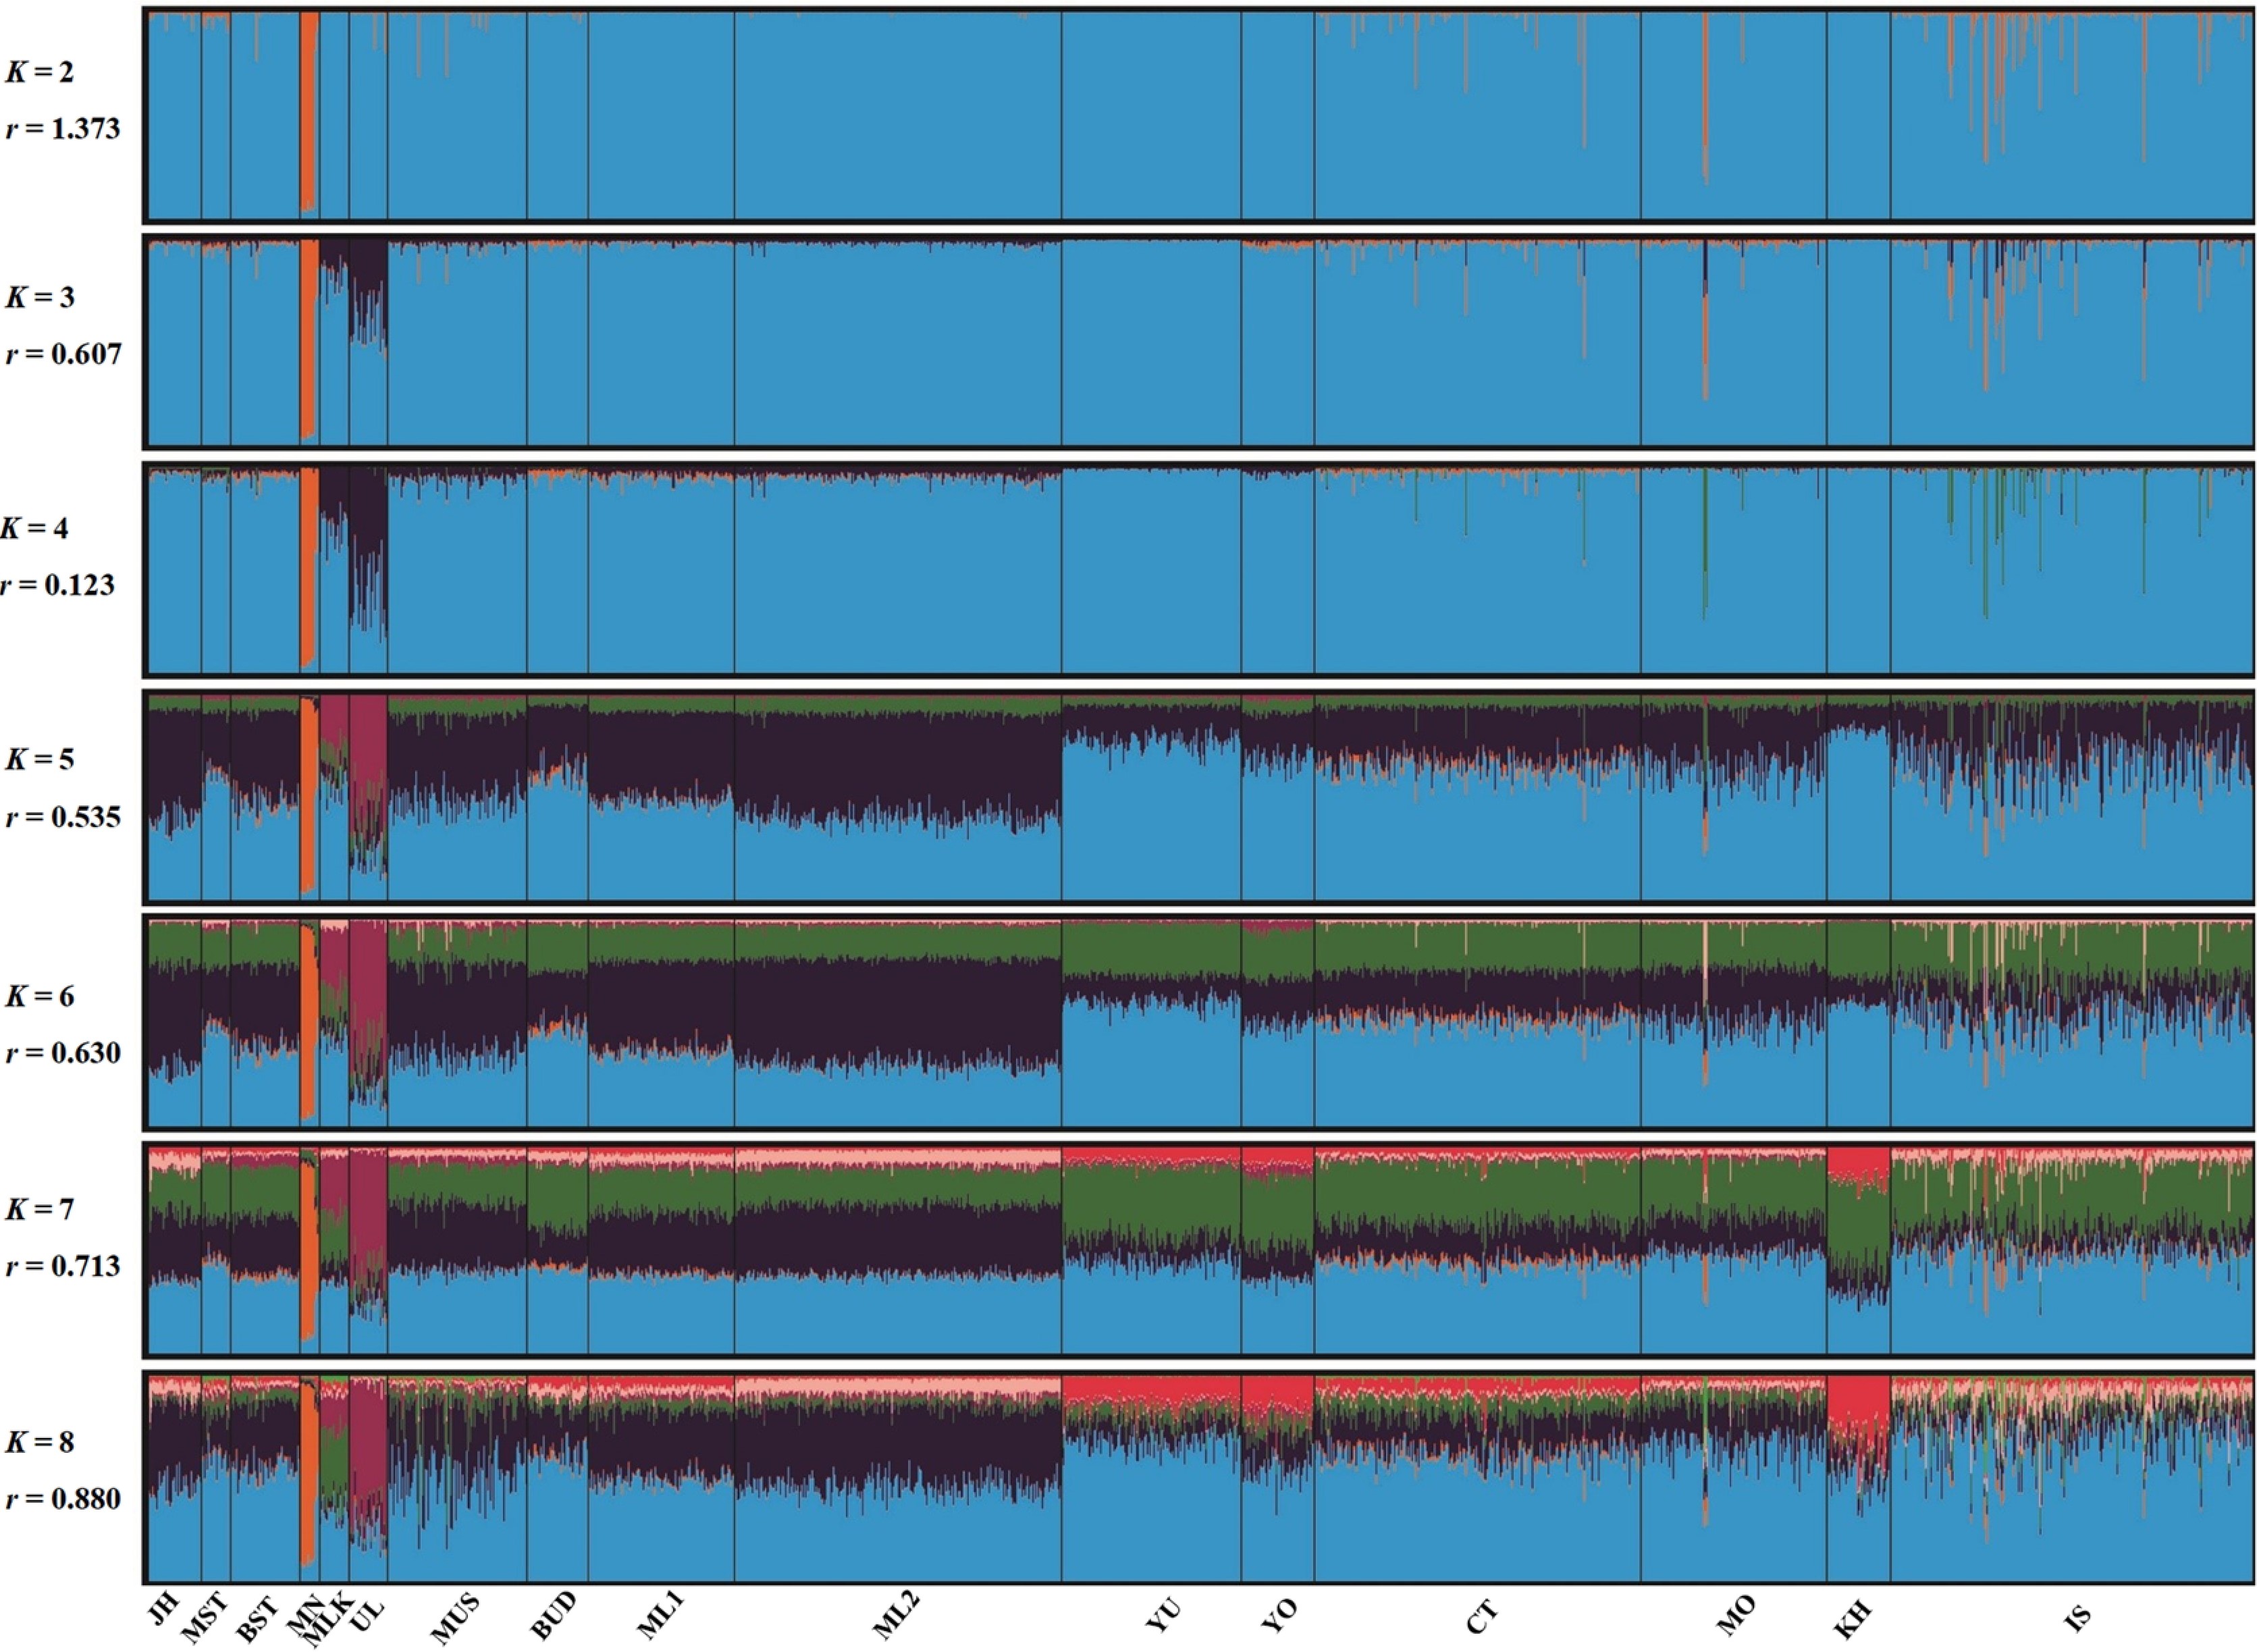
Southern populations form their own group. More than half their ancestry comes from sources outside the Tai-Kadai world. Among the sampled populations, they are closest to the Mon. Ancestry related to South Asia has been reported in these populations, the central groups, the Mon and the Austronesian-speaking population of the far south. An Austroasiatic-related source contributes most of their ancestry overall.
On markers selected to distinguish northern from southern Thai, the southern samples carry a stronger South Asian component than the northern samples.
Maternal variation
Complete maternal genomes from eight populations in the south contained 68 lineages, 28 of them not previously recorded in the region. The two Tai-Kadai-speaking southern Thai samples had the widest maternal variety of the eight, and no sequence was shared between any two people within either sample. One of the two also shared sequences with Khmer sampled in Cambodia.
An early survey of the maternal molecule found the opposite pattern in the far south. Twenty people sampled in Trang province carried four sequence types between them, all four confined to that sample, and one was carried by 14 of the 20. They had the narrowest variation of the eight populations compared in the survey and were the most distant from all of them. A nine-letter deletion found in 18 to 40 percent of the people in each of the other seven populations was absent from the Trang sample entirely.
Relations with Malay-speaking populations
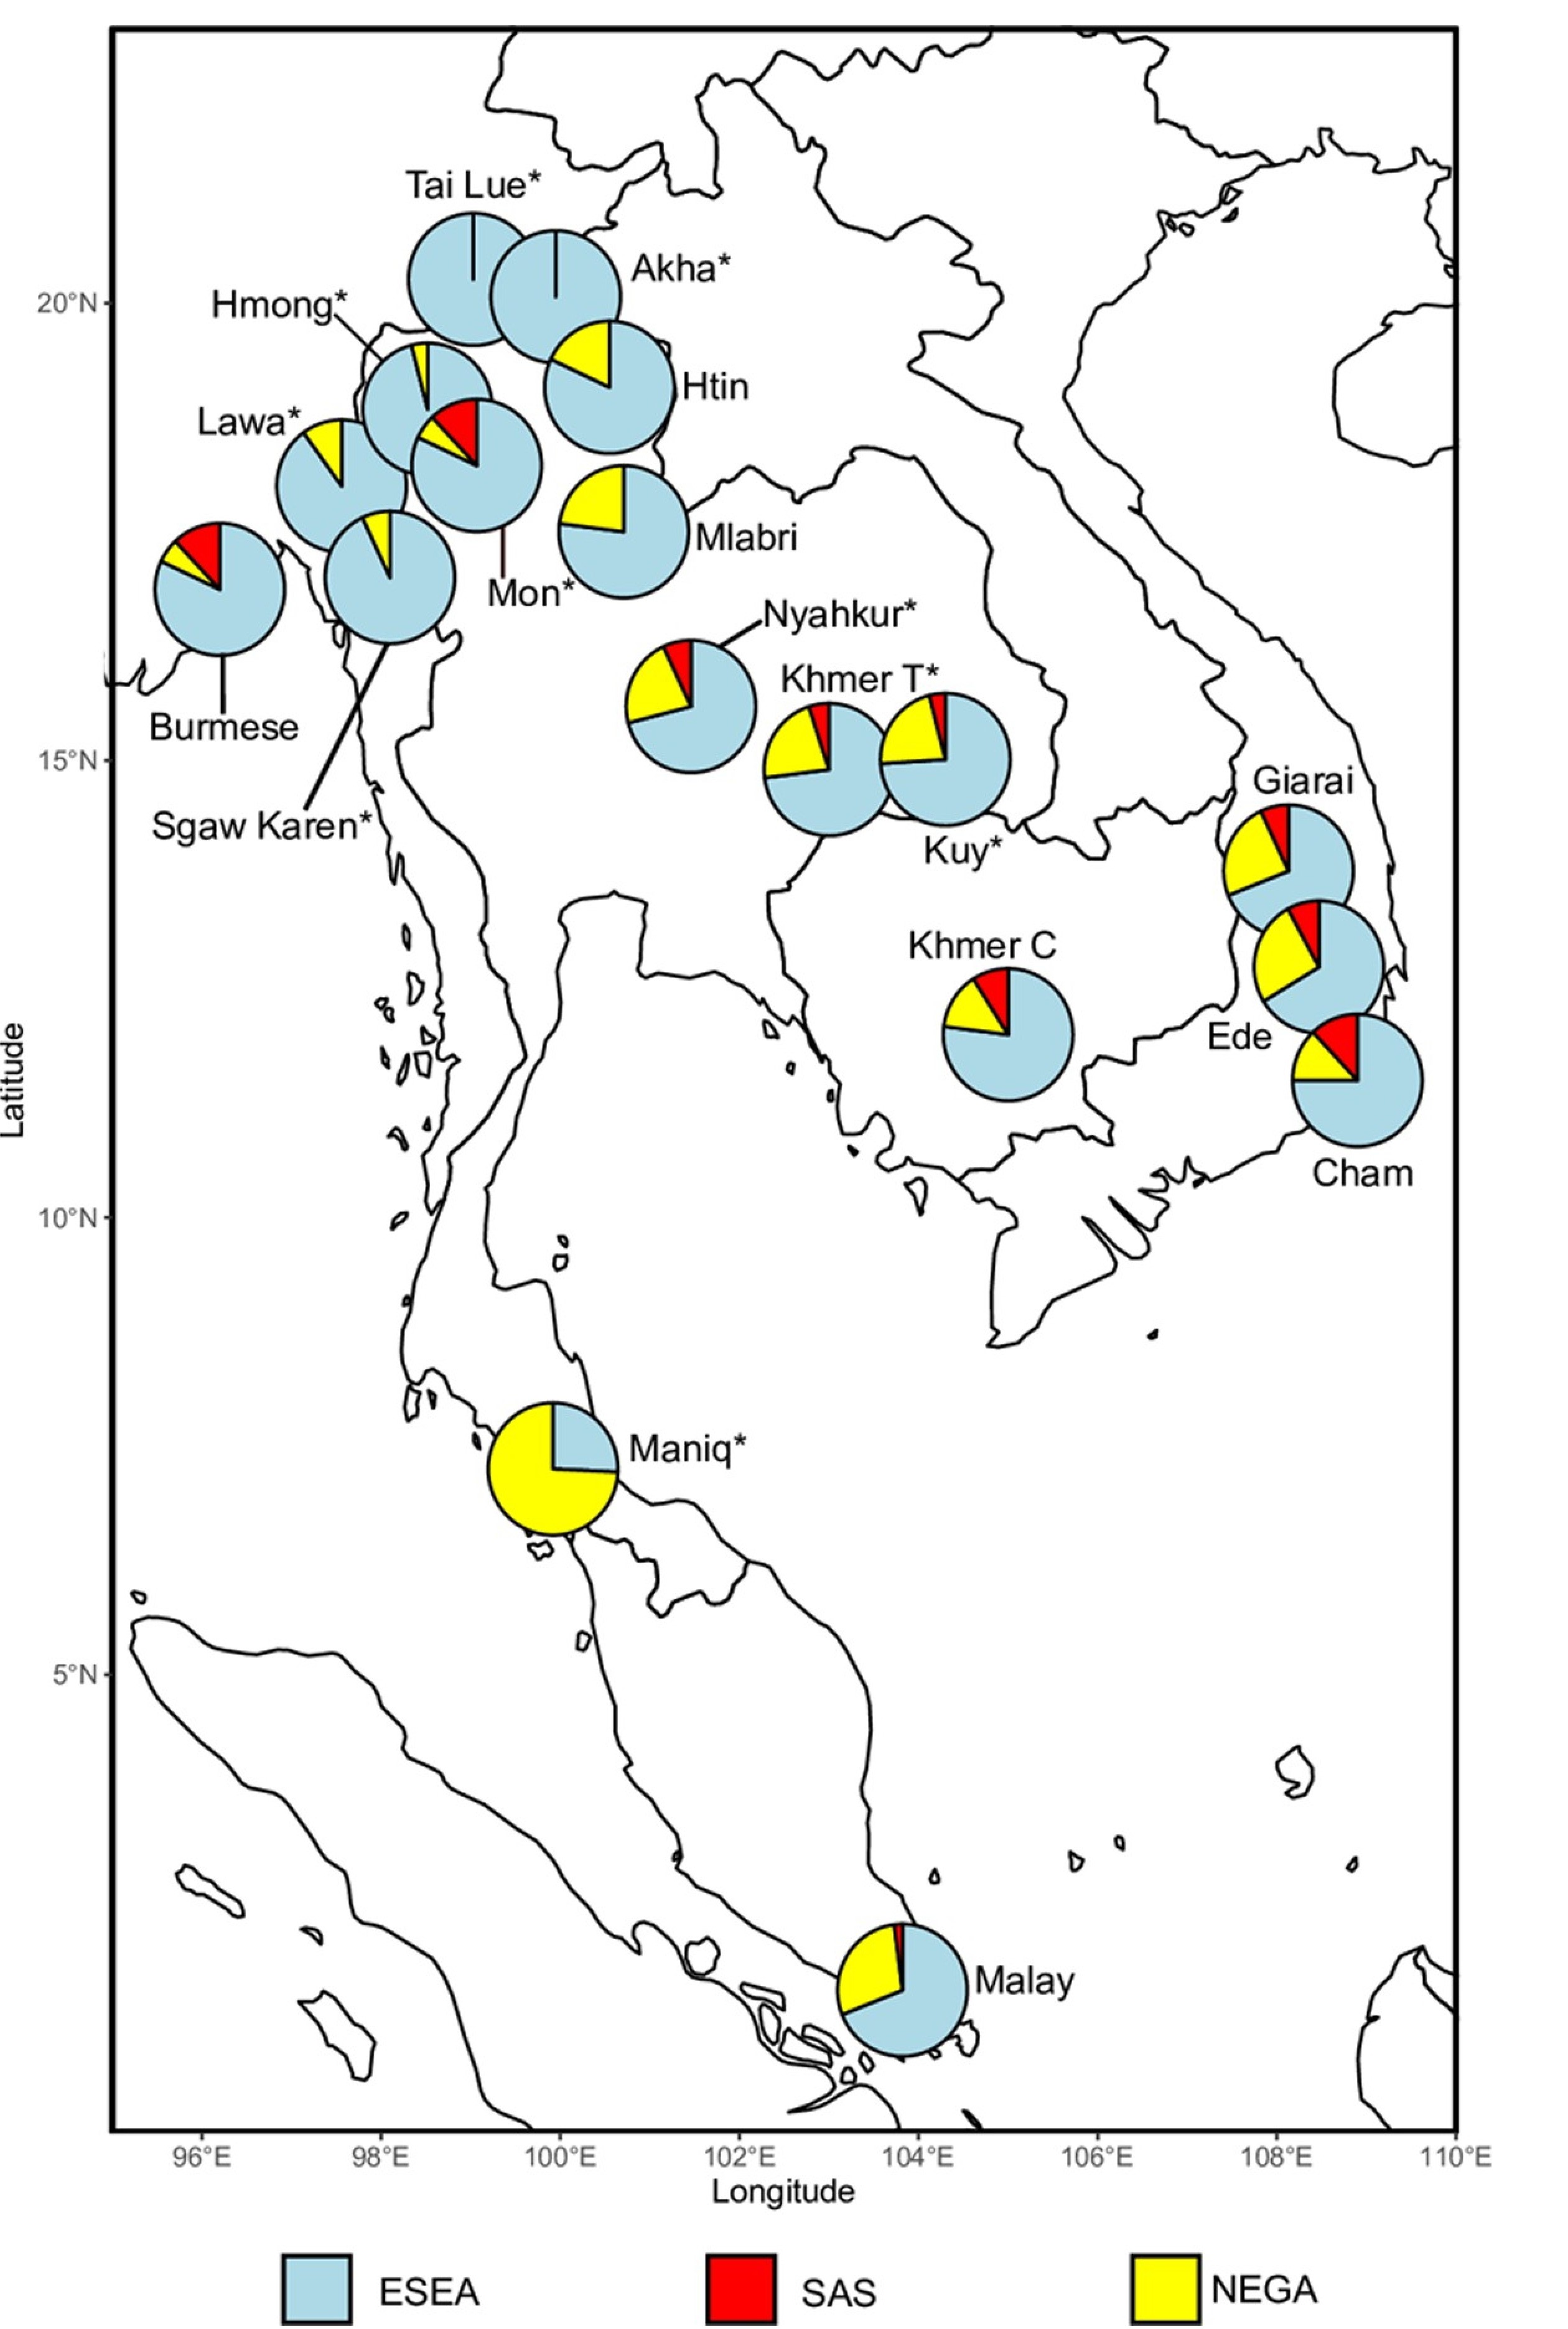
The sampled southern Thai and the Malay-speaking Nayu of the far south have exchanged ancestry heavily in both directions. About two thirds of the recent ancestry of southern Thai traces to a Nayu-related source, and about 57 percent of Nayu ancestry to a southern Thai source. When each is excluded as a possible source for the other, the leading sources become a Malay group from Singapore for the Nayu, and Lao and the same Malay group in almost equal proportions for the southern Thai. This level of Austronesian-related ancestry distinguishes the southern Thai from the other Tai-Kadai-speaking populations of the country.
Complete maternal genomes have been obtained from 23 people of a Tai-Kadai-speaking southern Thai group and 23 women of the Malay-speaking Nayu, along with about 2.3 million positions on the Y chromosome from 20 men of the former group. Maternal lineages common in South Asia were found in 10 of the 23 people in the Tai-Kadai-speaking sample and 8 of the 23 Nayu, while lineages common in Southeast and East Asia occurred in 9 in each group. On the paternal line, 7 of the 20 men carried lineages common in South Asia and 8 carried O-group lineages common in Southeast and East Asia. On the maternal line, both groups are closest to the Mon; on the paternal line, the Tai-Kadai-speaking sample cannot be distinguished from any of the central Thai samples compared.
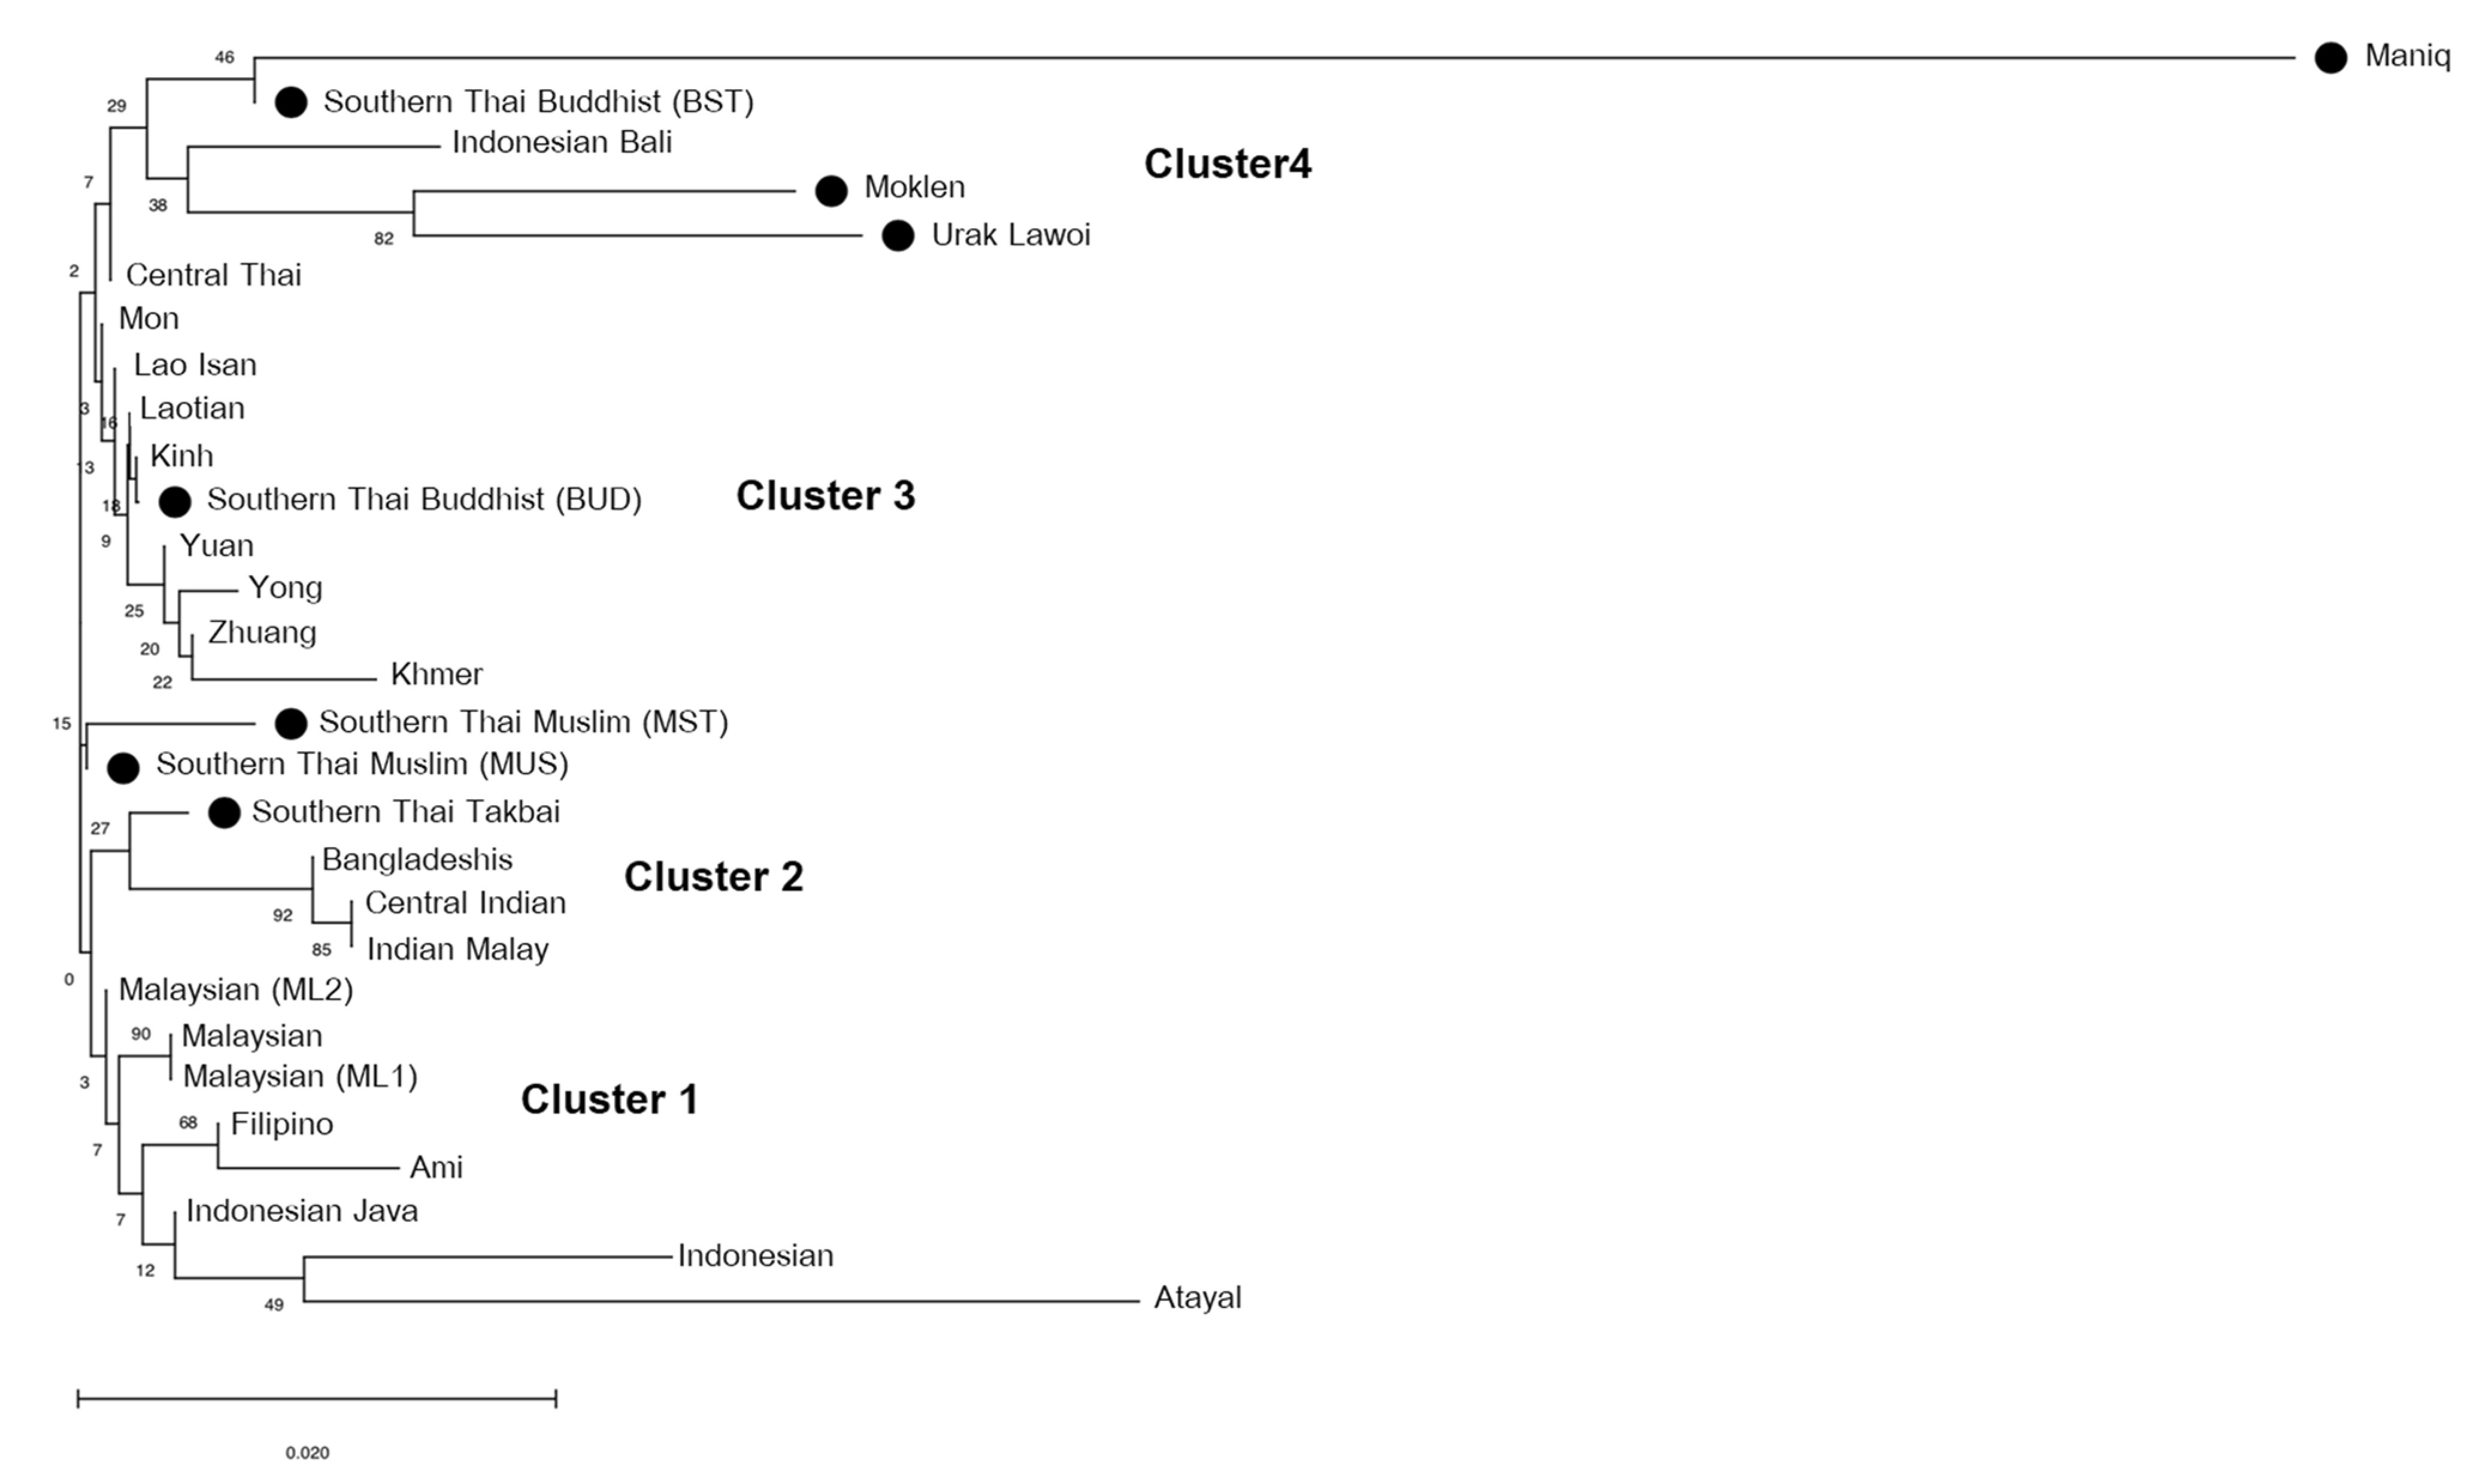
Repeated sequences on the other chromosomes have been typed in 334 people from nine southern populations. The major southern Thai samples are closer to the sampled central Thai than to populations from any other region, and are also close to Malay samples from Malaysia. The study reads this pattern alongside accounts of movement from the central plain southward during the Ayutthaya period and later mixing with Malay populations. In a tree of 29 Asian populations, the two southern Thai Muslim samples and a Tai-Kadai-speaking sample from Takbai sit beside the South Asian branch. The two southern Thai Buddhist samples fall on different branches, one among the mainland Southeast Asian populations and the other among the sea nomads.
Two southern Thai samples taken far apart, one in Narathiwat and the other in Phuket and Nakhon Si Thammarat, have a similar paternal make-up. Both are close to the Mon of the west, Austronesian-speaking groups in Malaysia and South Asian populations.
Ranong province
In Ranong province, on the Andaman coast, 53 men were tested with the same fixed list of Y-chromosome mutations used in Tak. No lineage dominates. The commonest, O-M95, appears in 11 of the 53, while haplogroups K and R, both uncommon further north, appear in 6 men and 4. The study connects the first to the Maniq of the far south and to other long-established populations of the peninsula. It connects the second to South Asia, and points to the Indian, Persian and Roman goods excavated at the early port of Phu Khao Thong () in the same province.
On paternal lines the Ranong sample sits closer to the sampled central Thai and Mon than to the sampled southern Thai. It also carries a wider range of lineages than the Tak sample, which the authors attribute to its history as a maritime trading point against the more enclosed position of Tak inland.
Ethnolinguistic groups
Genetic structure broadly follows language family, but there is considerable variation within the Austroasiatic, Hmong-Mien and Sino-Tibetan groups and among the highland peoples. Within Austroasiatic, however, the correspondence breaks down: the sampled populations fall into genetic clusters that do not match the branches of their languages. Not all nine officially recognised highland groups are as isolated as might be expected. The Lawa, Iu Mien and Lisu share more genetic similarity with their neighbours than the other groups do.
Variation within and between language families
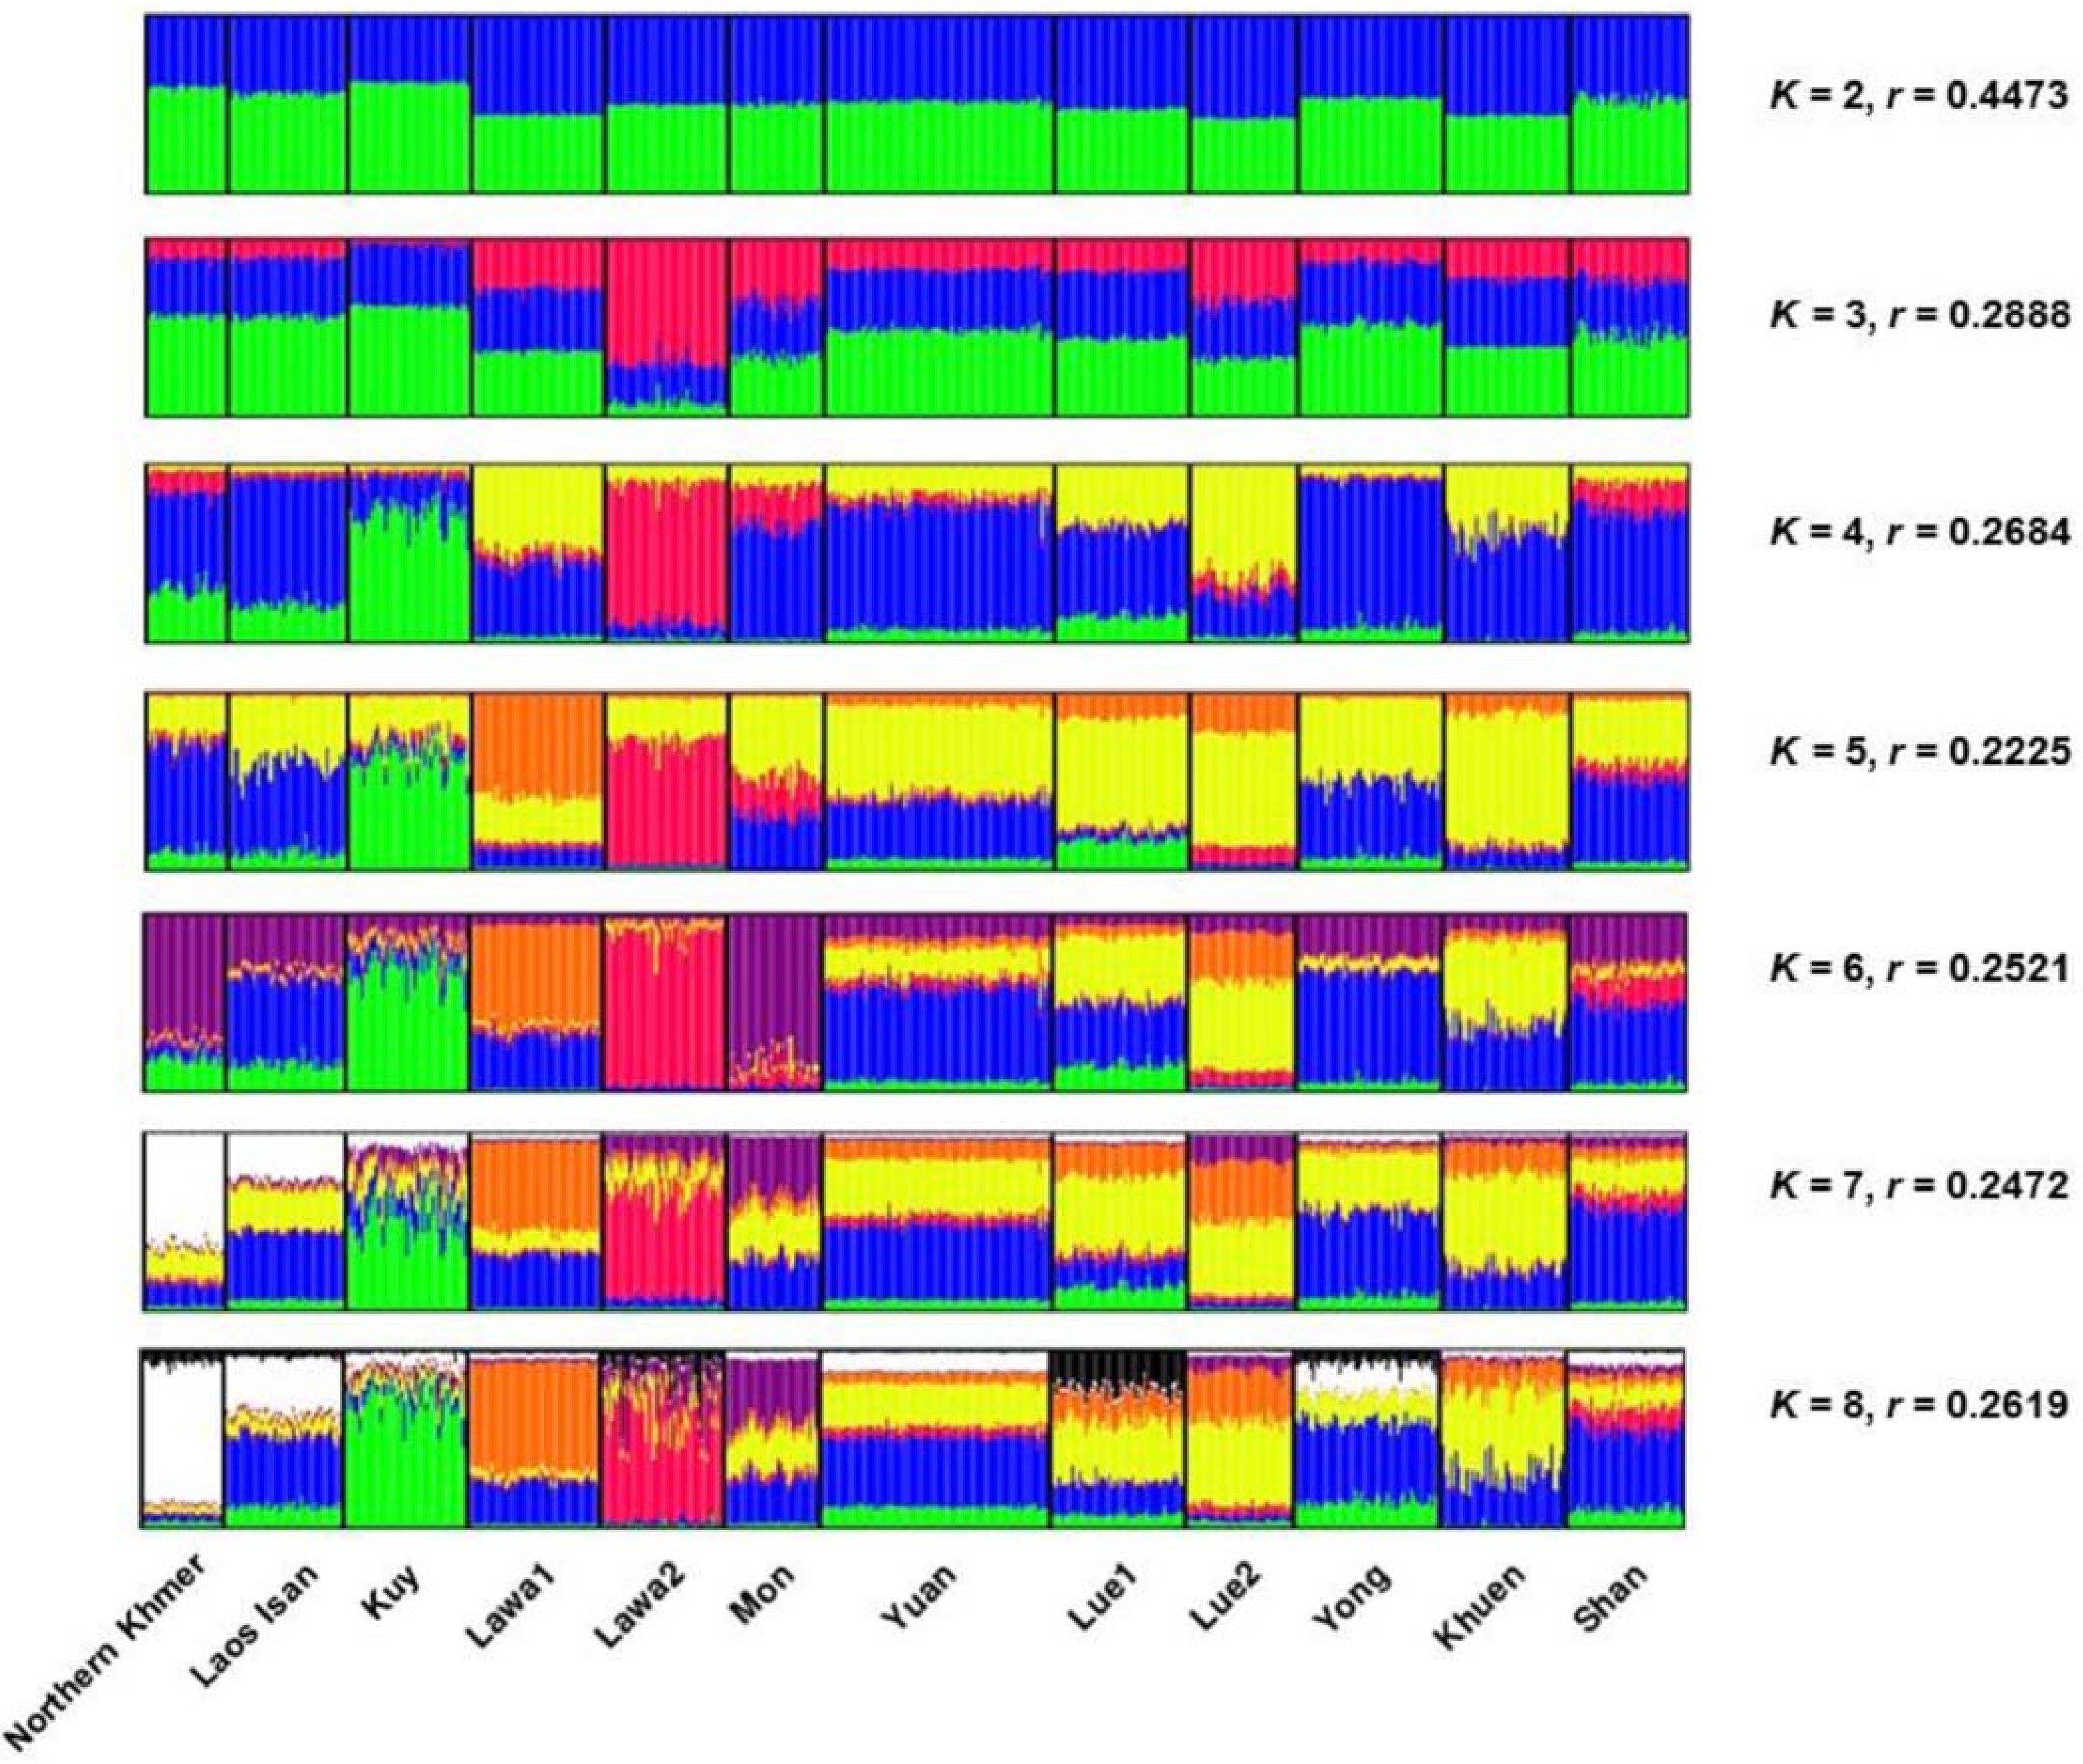
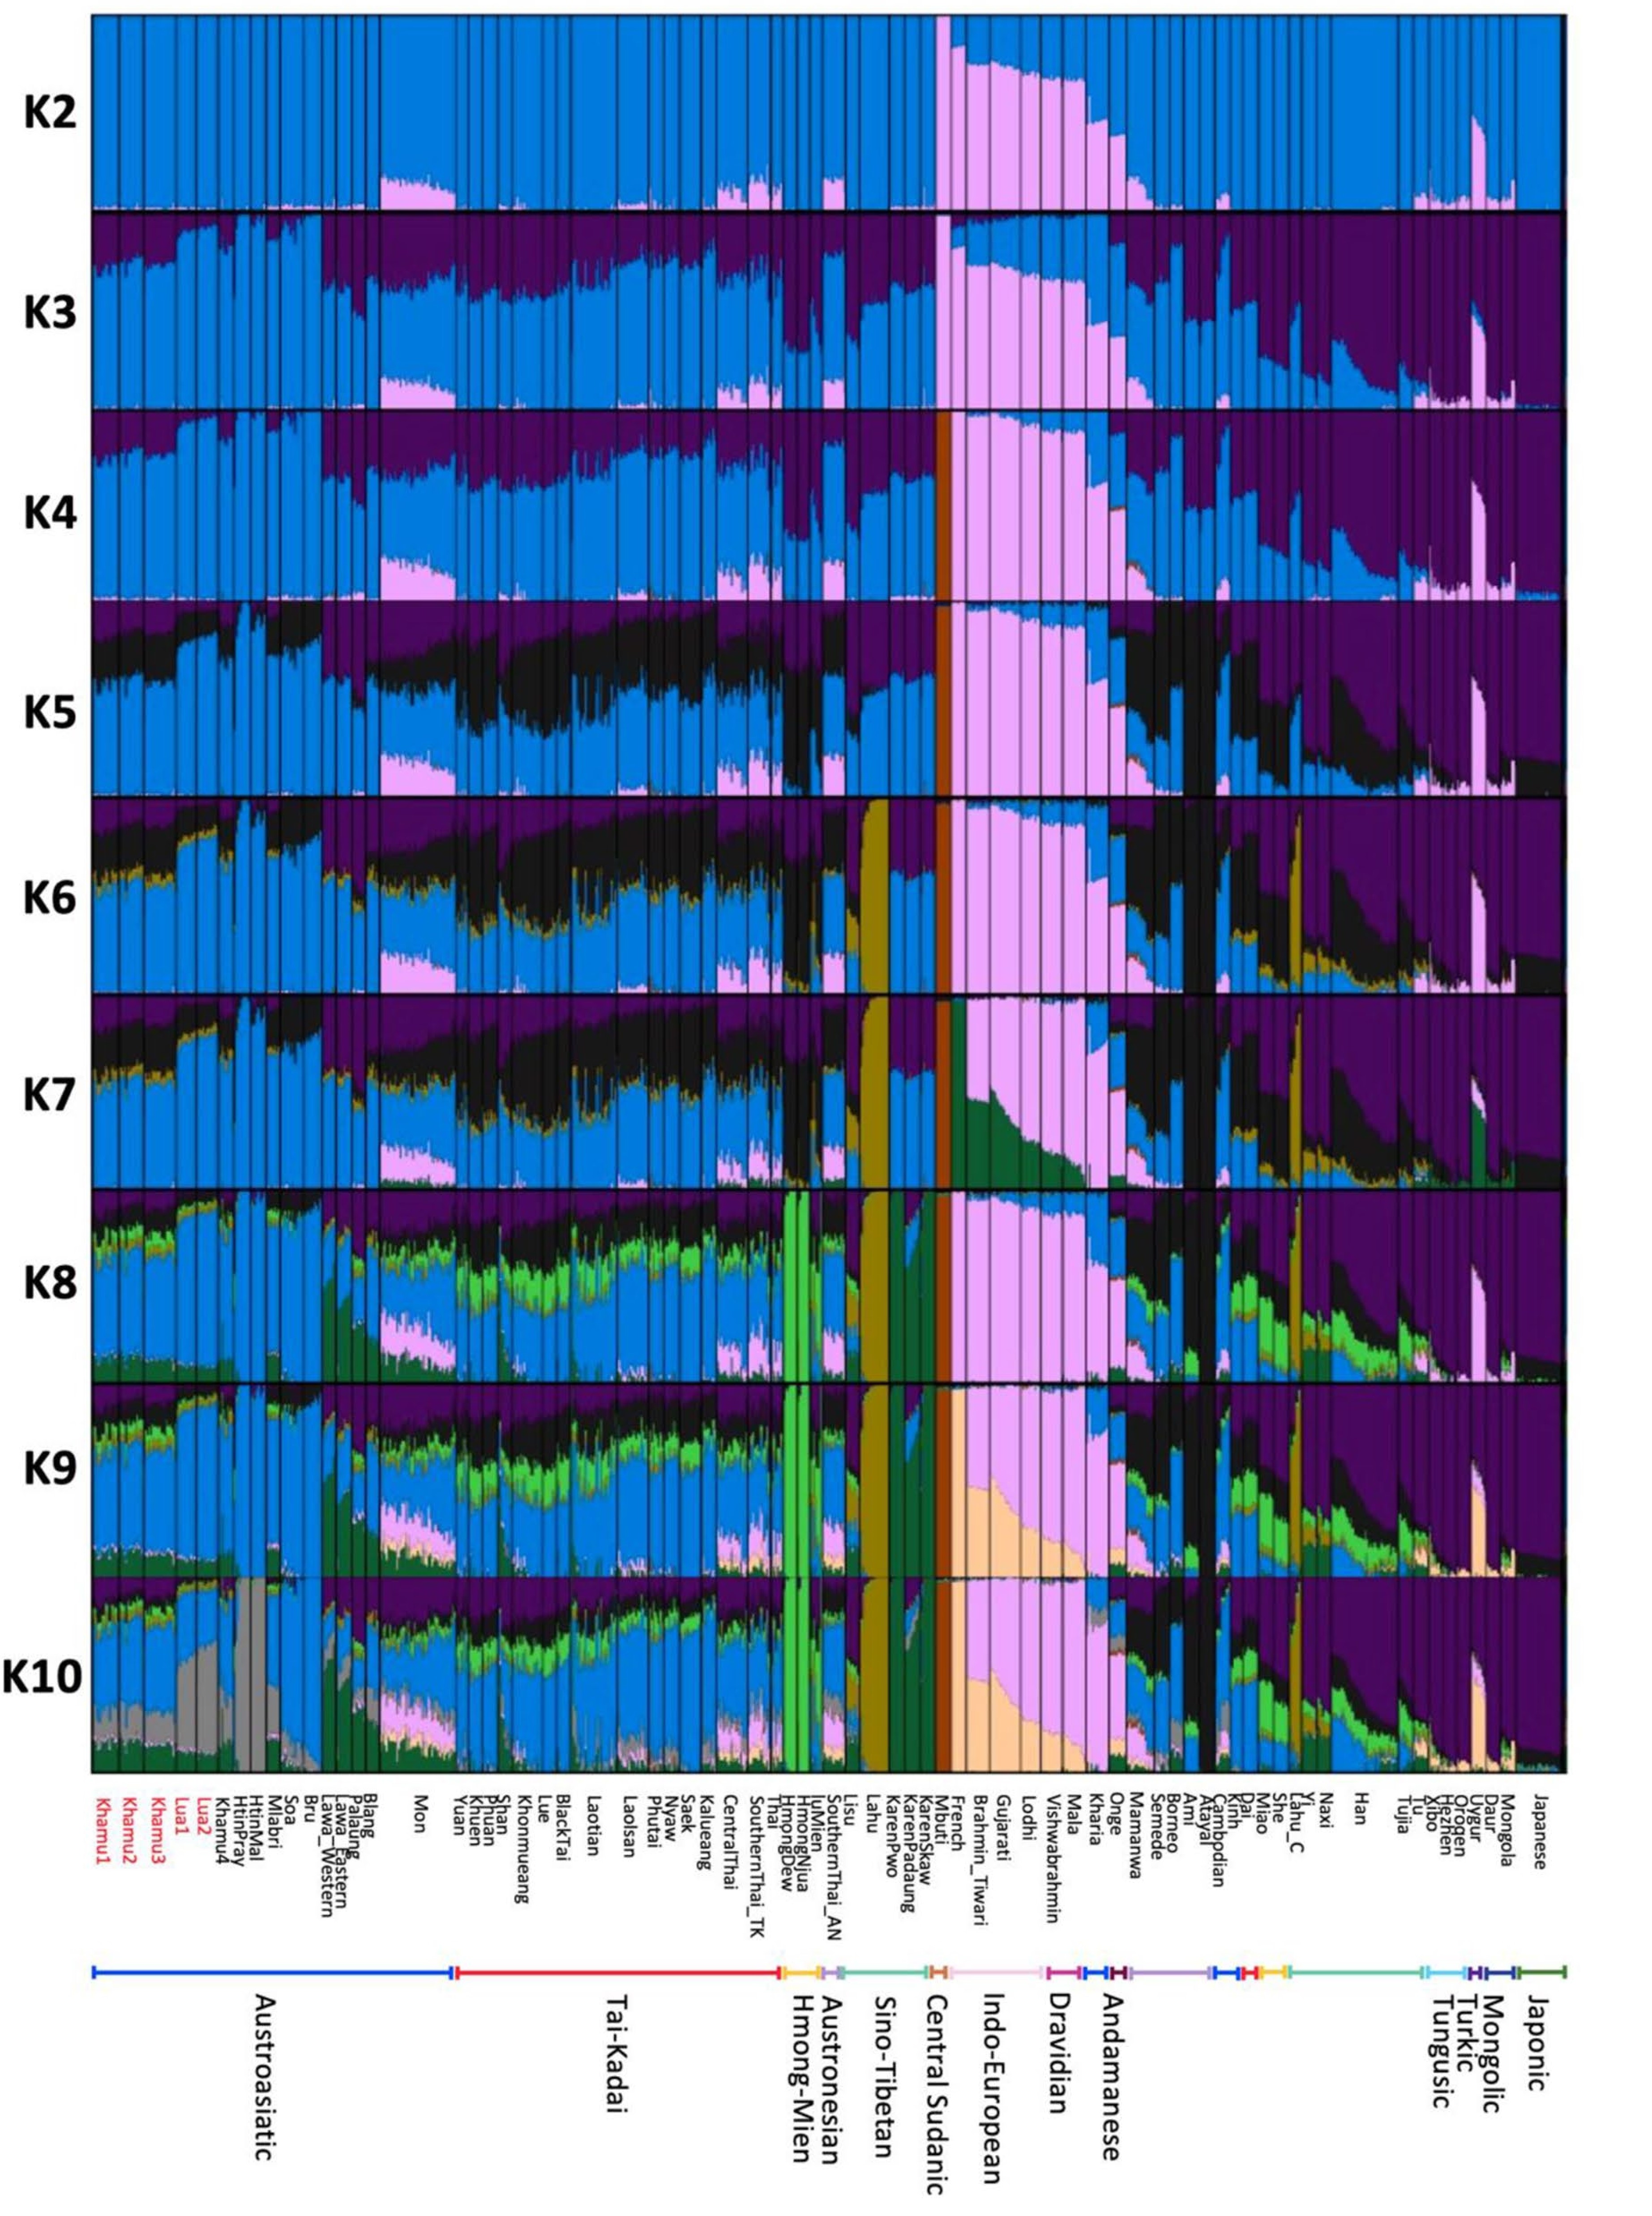
A survey covering all nine officially recognised highland groups, together with four without that status, found language family to be a weak predictor. Language family accounted for about 1 percent of the variation among these populations, compared with about 3 percent for differences between populations within each family. Differences between populations were widest among the Austroasiatic speakers and narrowest among the Tai-Kadai. A larger comparison of 26 populations in the northeast, the north and Laos puts the first figure lower still. Language family accounts there for about a tenth of a percent of the variation, while differences between populations within a family account for about 1.4 percent. The differences among the sampled Austroasiatic populations are again about twice those among the Tai-Kadai.
Across 73 populations of Thailand and Laos analysed using complete maternal genomes, the same ordering holds, with the Sino-Tibetan speakers between the two. Differences between populations account for 11.1 percent of the variation among the Austroasiatic groups, 6.5 percent among the Sino-Tibetan and 4.6 percent among the Tai-Kadai. The sampled central Thai are the most uniform of the Tai-Kadai populations, at 1.6 percent, and the Lue the least, at 7.3 percent. The maternal line gives an even sharper picture. Across 51 populations, samples bearing the same ethnolinguistic name but taken in different places differ significantly from one another whenever more than one place was sampled. Sorting those populations by language family accounts for about 0.5 percent of the variation, compared with about 7.4 percent between populations within a family. Within individual named groups, the figure ranges from about 2.3 percent among the Lao Isan to about 25.7 percent among the Htin, and in four of the 51 populations no complete maternal sequence was shared with any other population. Among three Lao Isan populations in the lower northeast, differences between them account for about 3 percent of the maternal variation, and every pair differs significantly. Across 86 Asian populations compared using complete maternal genomes, the Tai-Kadai-speaking populations differ from one another less than those in any of the other four language groupings, while the populations grouped as indigenous hunter-gatherers differ the most.
Complete sequences of the male-specific part of the Y chromosome from 928 men in 59 populations of the two countries are dominated by two lineages. O-M95 accounts for about half of the sample and exceeds 70 percent in nearly half the Austroasiatic populations, while O-M324 accounts for about a quarter and is more common in most Tai-Kadai populations and in all four Karen samples. On these sequences, the three families have a different order. Differences between populations account for 20.0 percent of the paternal variation among the Austroasiatic groups, 4.5 percent among the Tai-Kadai and 2.3 percent among the Sino-Tibetan, with the last not statistically significant. The Austroasiatic figure is higher than its maternal counterpart and the Sino-Tibetan figure lower, so the two lines do not rank the three groups in the same way. On the Y chromosome, the gap is wider still. Across eight northern populations, differences between the two sampled Austroasiatic groups, represented by 12 and 26 men, account for 24 percent of the variation, compared with 0.4 percent among three Tai-Kadai groups. The study cautions that several of its samples contain fewer than 20 people. An earlier survey of eighteen northern populations puts the same division at about 2.1 percent of paternal variation and about 1.5 percent of maternal variation, with only the latter statistically significant. Its authors add that the figures are difficult to interpret because the two groups differ greatly in their internal variation.
Austroasiatic groups
The widest variation is among the northern Austroasiatic groups, which divide into two. The Mlabri and the group recorded as Lua or Htin have much in common with each other and much less with the Khmu. The lowland Austroasiatic groups of Thailand, Laos and Cambodia form a looser group of their own.
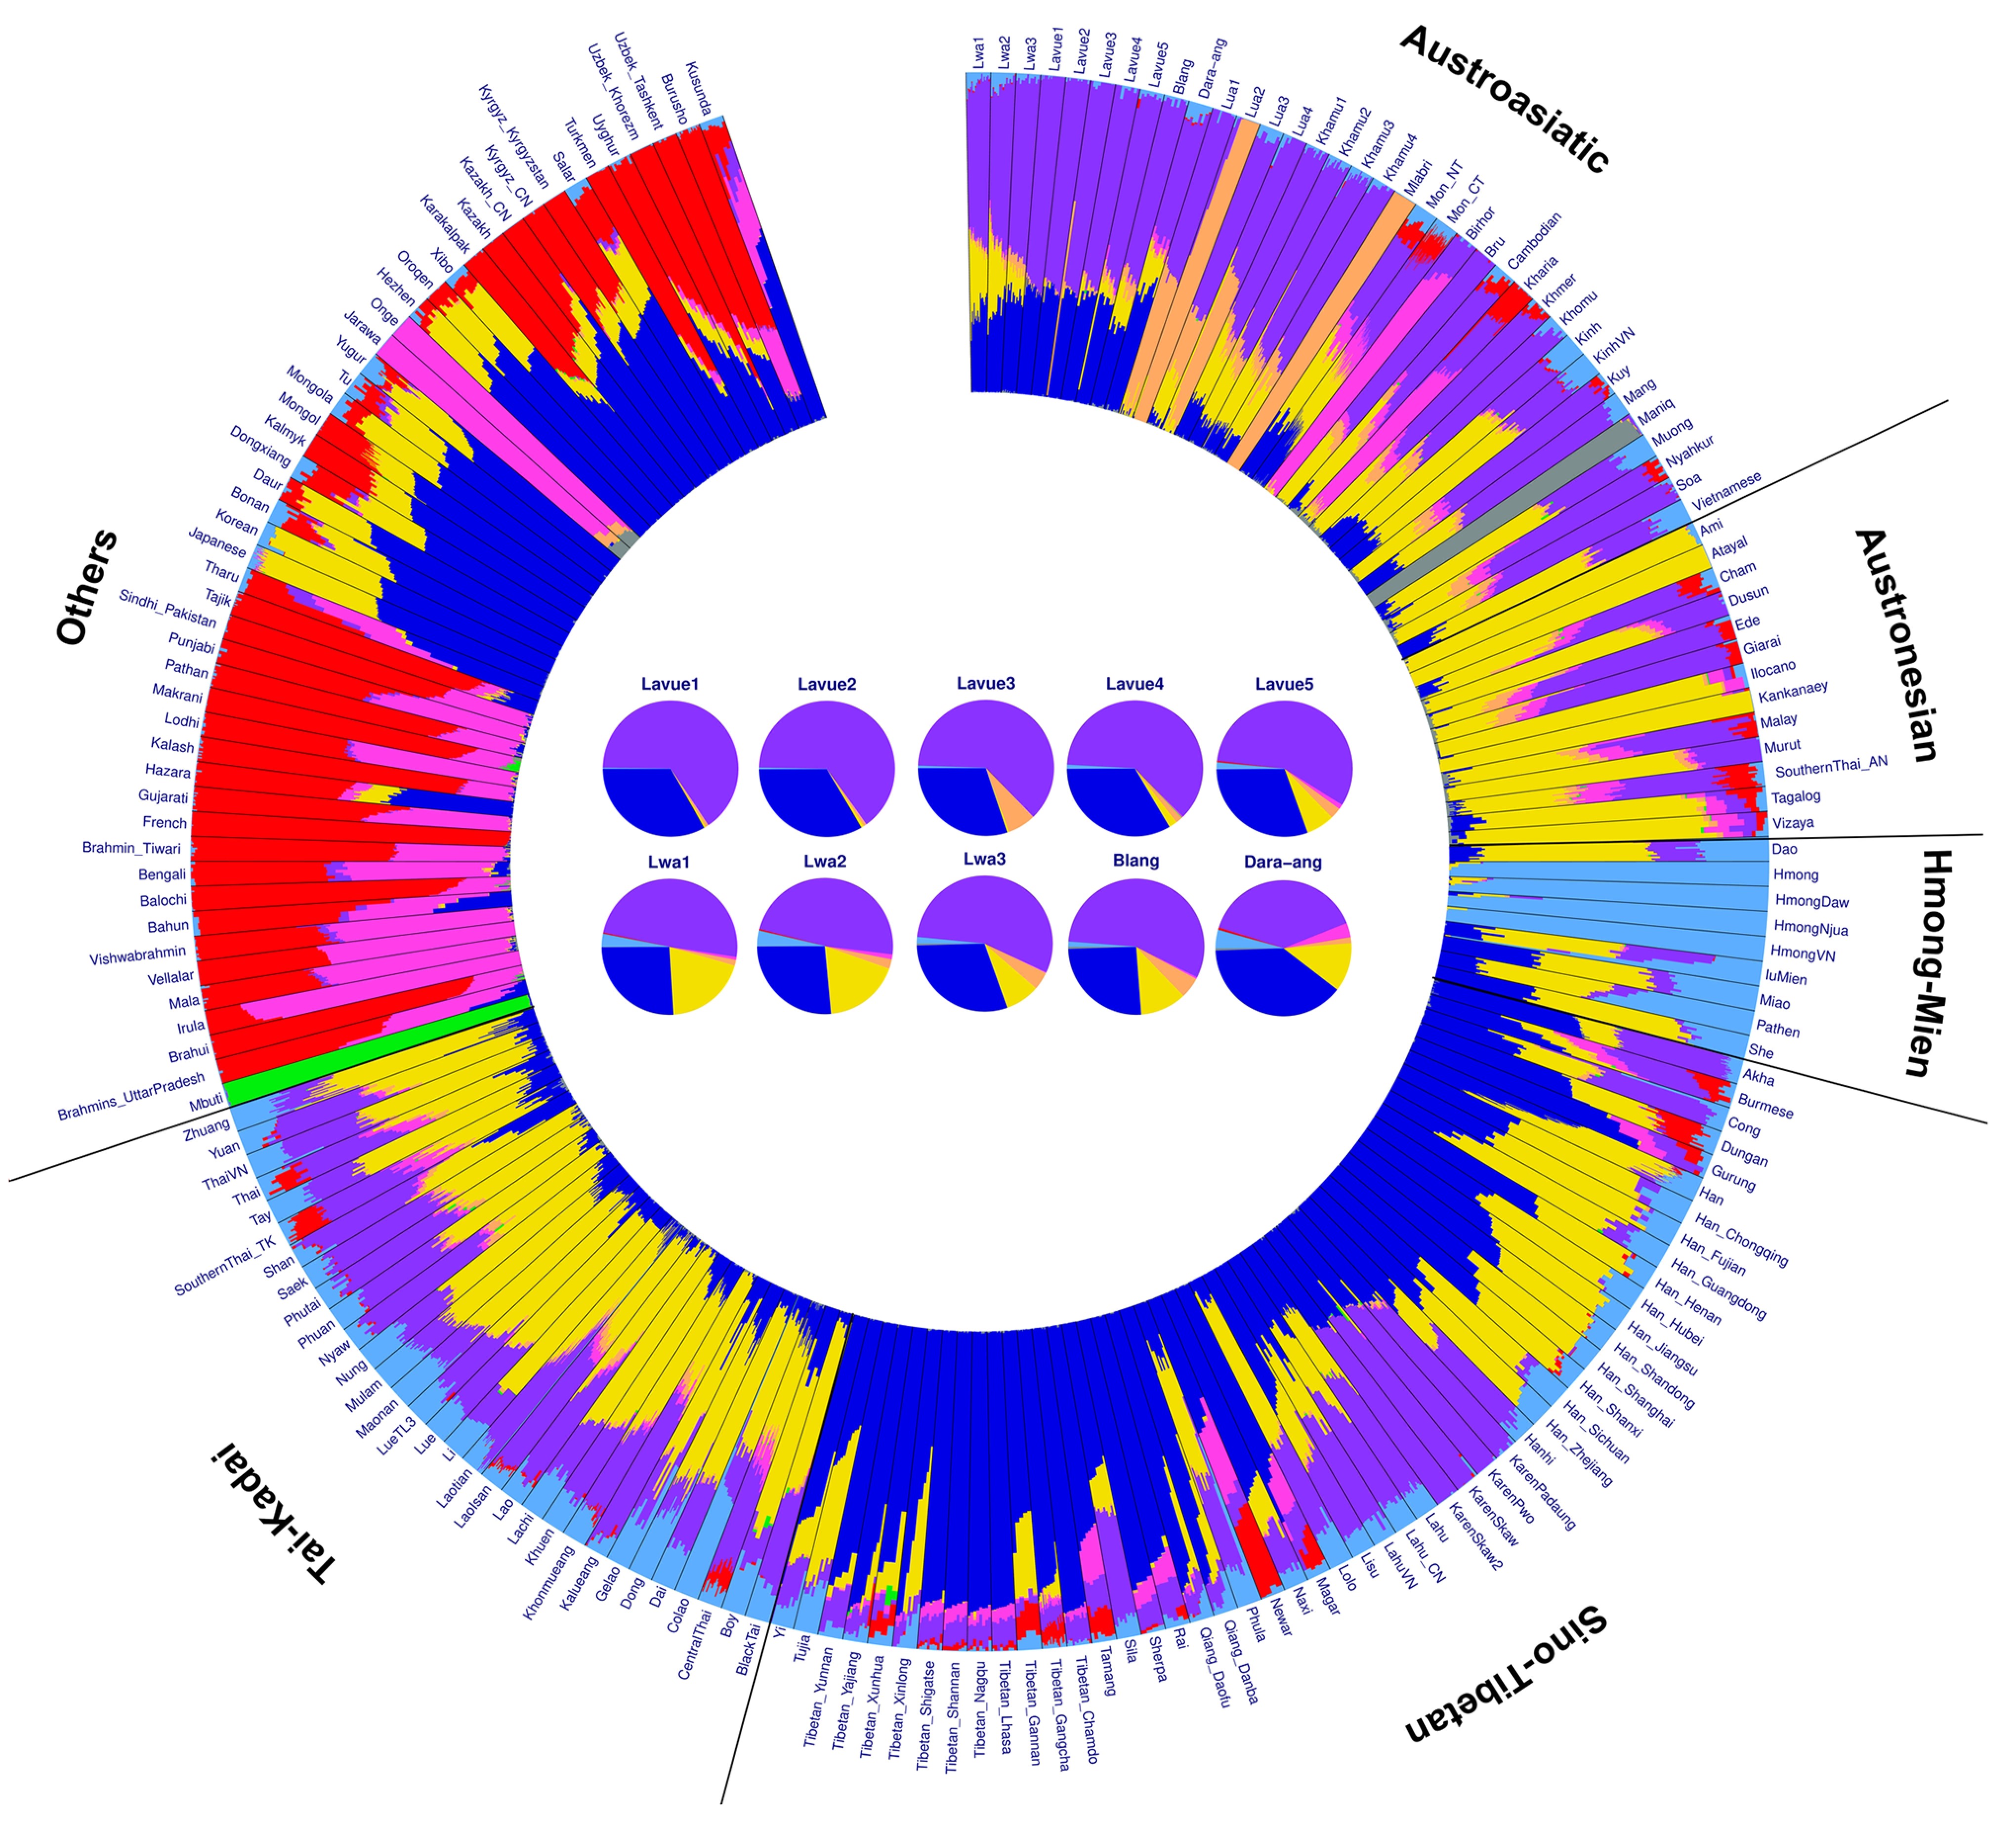
Genome-wide data from Palaungic-speaking villages in Chiang Mai and Mae Hong Son divide the northern groups along the same lines as their languages. The Monic, Khmuic and Palaungic branches each have a different genetic make-up. The Khmuic-speaking Lua of Nan share more of their genome with the Khmu and the Mlabri than with the Palaungic-speaking Lavue and Lwa of the northwest, although the name Lua is used for both groups.
Contact between Austroasiatic speakers and their neighbours can be dated from the length of chromosome segments they share, which tend to be longer when the common ancestor is more recent. The clearest signal falls around 1,200 years ago, while most groups show a rise in population size around 4,000 years ago.
On the maternal line, the Austroasiatic-speaking populations carry more variation than the Tai-Kadai-speaking ones, as well as more lineages that branch early in the tree. They also differ much more from one another: about 11.4 percent of the variation among them, compared with about 4.7 percent among the Tai-Kadai. An earlier survey of 36 northern populations found the same contrast more sharply. Differences between the Austroasiatic populations accounted for about 22.8 percent of the variation within that group, compared with about 4.6 percent among the Tai-speaking populations and about 7.7 percent among the officially recognised highland groups. Several samples carry a single lineage at a high frequency, including haplogroup B6a in 72 percent of an Htin sample of 25 and haplogroup D4 in 20 to 32 percent of the Mon, Lawa and Palaung samples. The study reads these concentrations as chance changes in small, isolated populations, while the wider spread of lineages is consistent with Austroasiatic speakers having been in the area longer than Tai-Kadai speakers. In the hills, it attributes differences between samples of the same group to isolation and to a custom in which a husband moves to his wife's village. In the lowlands, it attributes them to recent gene flow with neighbouring populations.
An earlier comparison of 22 populations across East and Southeast Asia found the same wider variation among Austroasiatic speakers, with one exception. The Khmer sampled at the Cambodian border in Chanthaburi instead grouped with the Tai-Kadai populations rather than with the other Austroasiatic groups. The study interprets this as evidence of maternal exchange in both directions and connects it to the period of Khmer rule over the Tai in the twelfth and thirteenth centuries.
The division is also clear in the distribution of individual lineages. Across eighteen northern populations, about 97 percent of paternal profiles and about 77 percent of maternal sequences occur in only one population. The Austroasiatic-speaking and Tai-speaking populations share only one paternal profile and 22 maternal sequences. A clustering analysis of the paternal data placed all ten Tai-speaking populations in a single group, while the eight Austroasiatic populations fell into five separate groups. The maternal data show a different pattern: only one population, an Htin village, separates from the rest.
Khmuic branch
The group called Lua has three names. Lua is what its members call themselves, Htin is the term used by Thai officials, and Lawa is a name mistakenly applied to them that properly refers to an unrelated group in the northwest.
The two Khmuic-speaking populations of Thailand, the Khmu and the Lua, stand apart from every other population sampled in the country and in East Asia. Their villages in Nan province were sampled specifically to investigate this distinction. The two nevertheless differ from each other. Three Khmu villages in three districts resemble one another closely, and all three are more similar to the Tai-speaking Lue, Yuan and , and to the Hmong, Iu Mien and Lisu, than to the Lua. The study connects this pattern to the Khmu who came to Thailand in the nineteenth century to work in logging and elephant handling for French timber companies.
The Khmu also do not group with their closest linguistic relatives. Khmu, Mlabri and Htin all speak Khmuic languages, but the Khmu carry a different genetic component from the other two and fall closer to Tai-Kadai and Sino-Tibetan populations. The study attributes this to Khmu villages being located at lower elevations along the Lao border, as well as to recorded intermarriage and trade with neighbouring populations.
In a model of population splitting and mixing, about three quarters of Khmu ancestry comes from the lineage leading to the Mlabri and Lua. The remainder comes from a source related to populations of southwestern China. The authors regard the second component as a possible common ancestor with Tibeto-Burman speakers. This is consistent with a view that the Khmu moved south from northern Myanmar and Yunnan, although they note that the question needs further study.
An earlier survey examined a short stretch of mitochondrial DNA in 39 Khmu from one village in Thung Chang district, Nan, and found 12 distinct sequences among them. Fourteen of the 39 carried haplogroup F, including twelve with the F1a branch; seventeen carried B5a and six carried D. Two could not be assigned without data from elsewhere in the molecule. The 19 Mlabri compared with them carried a single sequence between them, matching one of the Khmu B5a sequences. On this evidence, the study proposed the Khmu as a possible ancestral population of the Mlabri alongside the Mal, extending an earlier interpretation that had named the Mal alone. Only the Mal are close to the Khmu on this measure; the Prai are not. The Khmu sample shows no sign of past population growth, which the study attributes to a founding group small enough to erase such a signal during a move from Laos about 150 years earlier.
Lua people
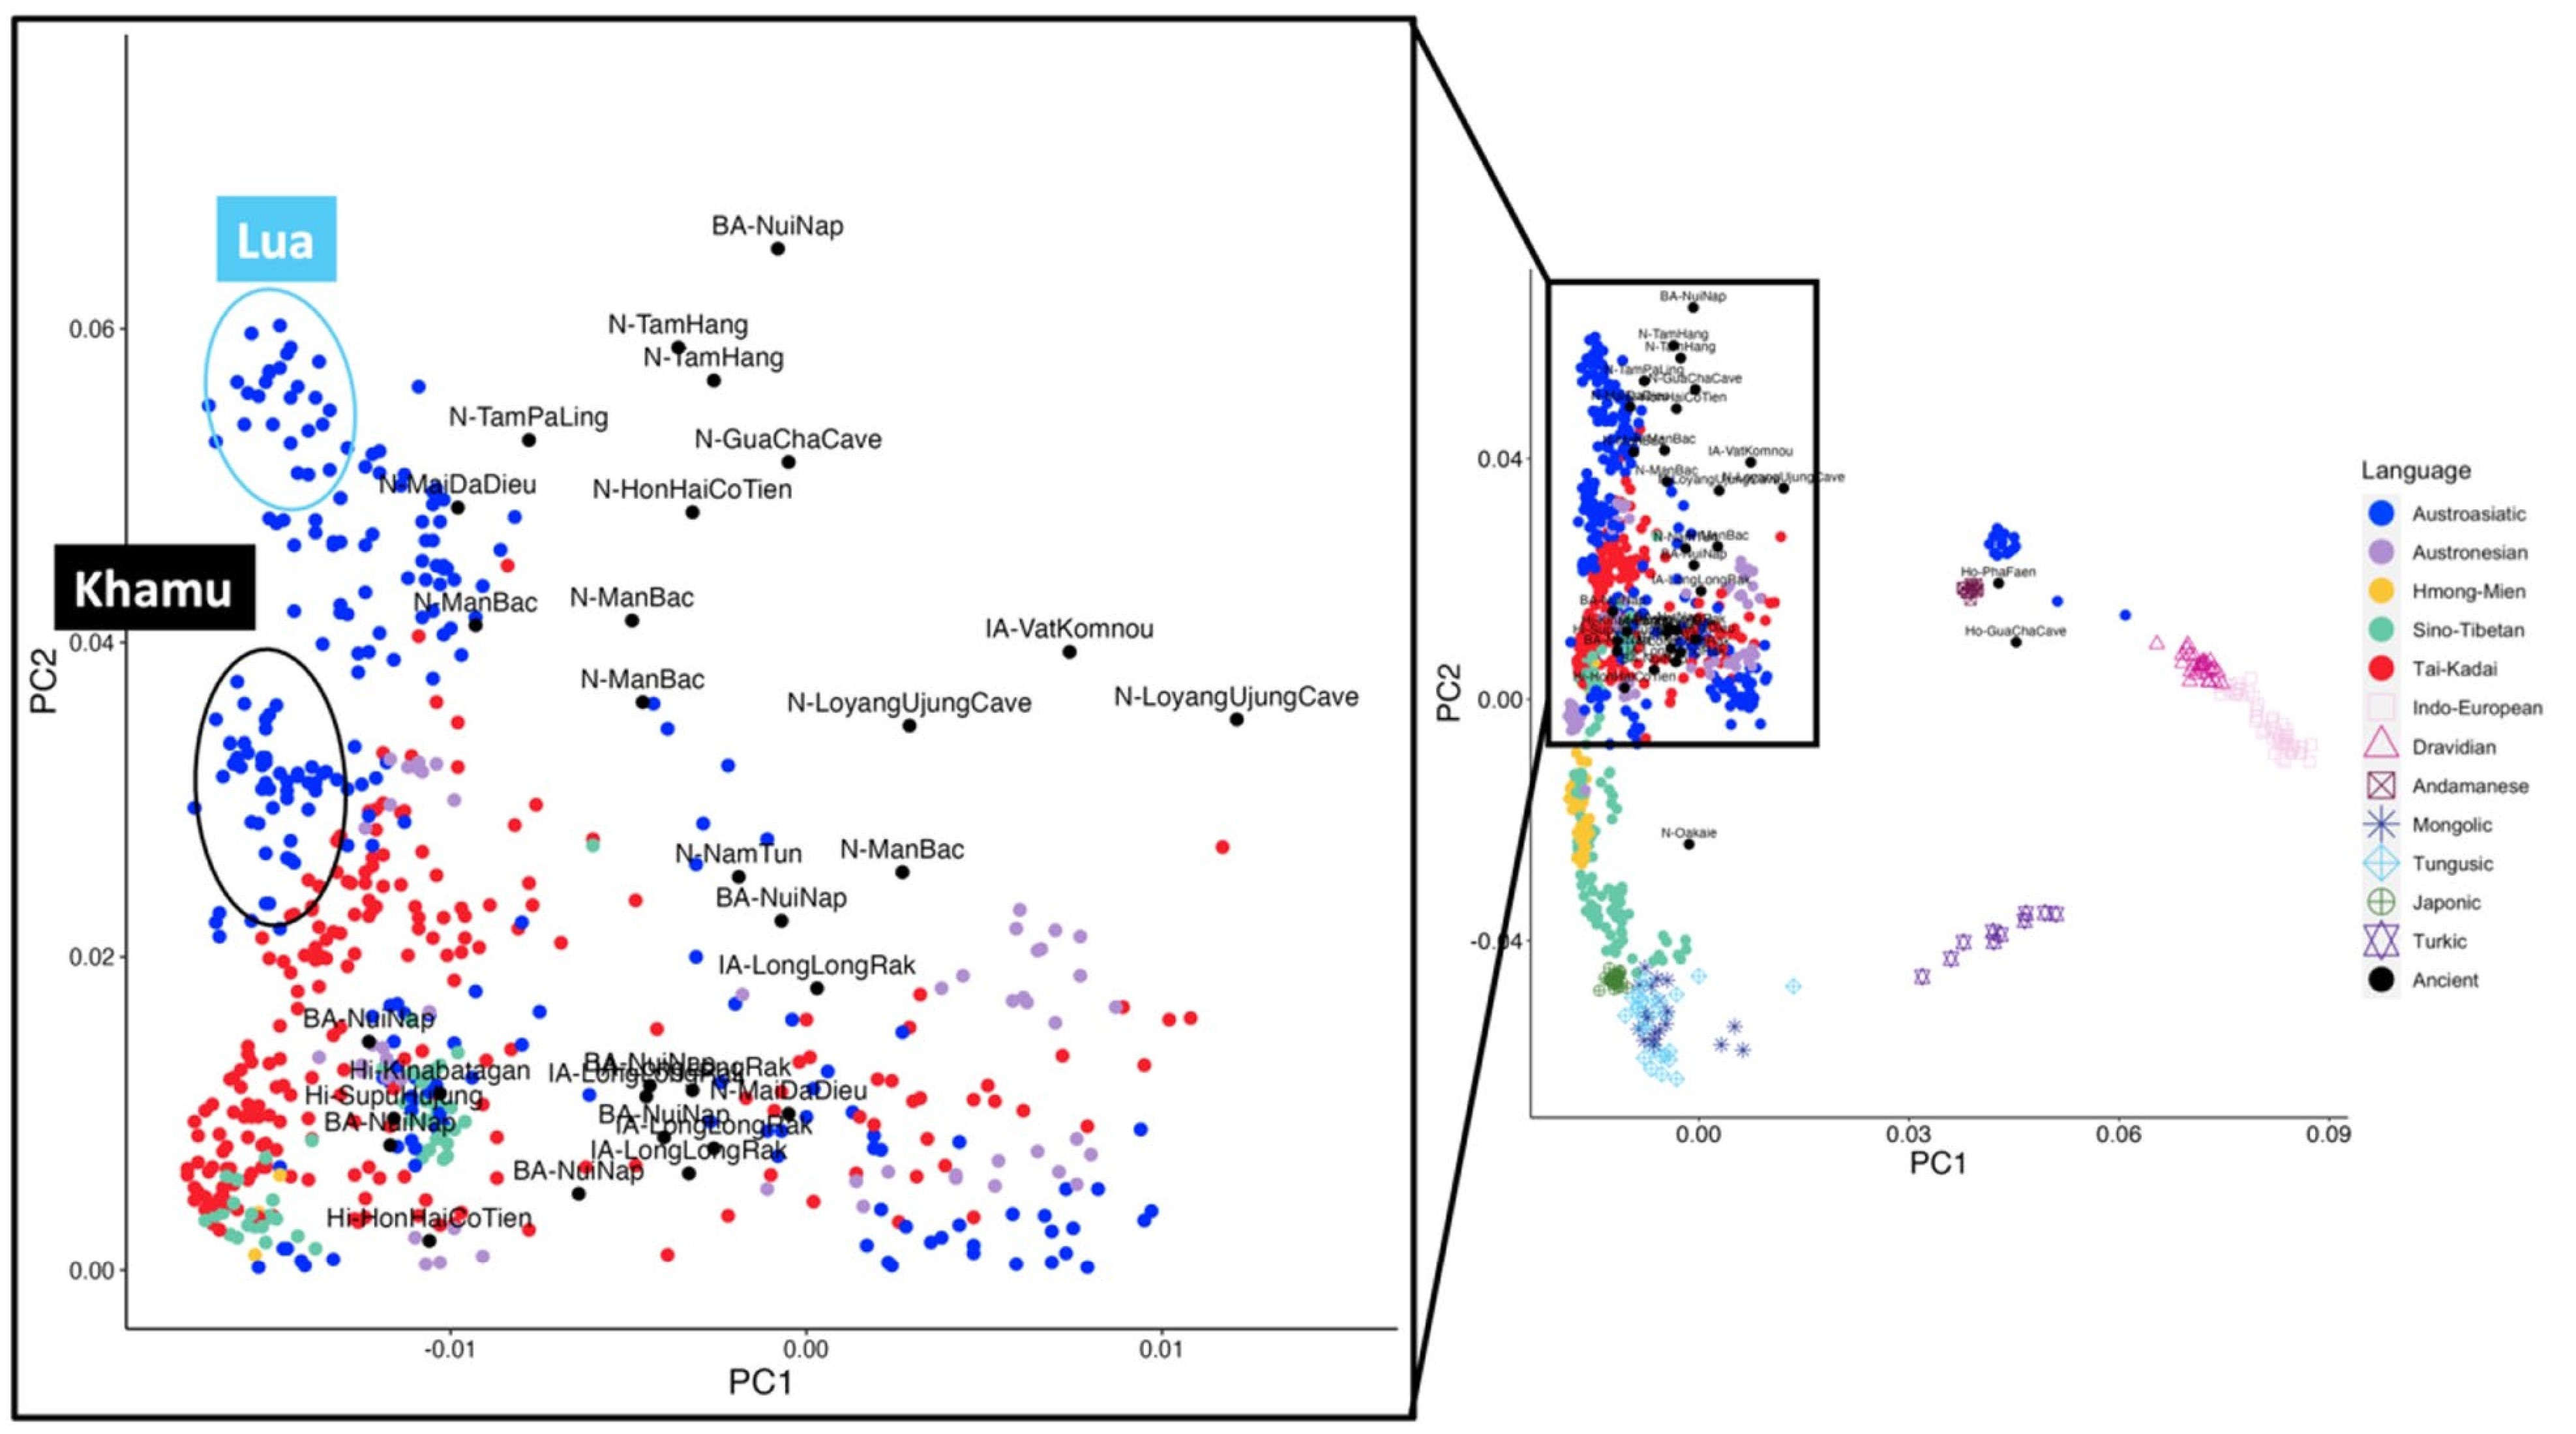
The Lua are more distinct and have the least internal variation among the Khmuic populations sampled. The study attributes this to descent from a small founding group, marriage within the group, and isolation in the mountains of Nan. Comparison of word forms has been used to date the separation of the Lua from the Khmu to about 600 years ago, followed by the division of the Mal and Prai about 200 to 300 years later. A model of population splitting and mixing places the Htin as a sister group of the Mlabri and fits both as carrying ancestry from an East and Southeast Asian source together with a deeply diverged East Eurasian source. The Mal and Prai differ genetically as well as in speech. A separate study reports some gene flow into the Prai villages from a neighbouring Lua village, but not into the Mal villages. The authors note that this Lua village was the most distinct of the 22 they sampled, and that its narrow range of variation may have produced the apparent gene flow. A later genome-wide study found no genetic evidence separating the two subgroups.
One Lua village in Bo Kluea district has the least internal variation of any population sampled in northern Thailand, which the study attributes to descent from a small founding group. In a separate survey of the paternal line, all 26 Lua men sampled carried O-M268, making the Lua the only one of eight populations in which a single lineage accounted for every man.
Mlabri people

The Mlabri are the most internally uniform population studied anywhere in the region. One study uses them to represent its oldest layer of ancestry. Their population is given as about 400 in one study and about 130 in another. Across fifteen repeated sequences, they carry 51 variants in all, compared with 81 to 126 in every other highland population sampled, and at one of the fifteen positions every person tested was identical. The study attributes this to a very small population living in isolation. Complete mitochondrial genomes from 18 Mlabri show a single maternal lineage, B5a1b1, with only one difference among them; ten Y chromosomes carry two paternal lineages. The authors interpret this as the result of a founder event about 1,000 years ago, in which a farming population, most likely the Htin or a close relative, took up hunting and gathering. The paternal lineages are closest to those of the Htin and Khmu, while the maternal lineage is closest to the Seak, So and Bru of the northeast.
A genome-wide comparison of thirteen populations from Thailand and four from elsewhere placed the Mlabri closer to the Htin than to any other population tested, by every method used. The authors present this as the first genetic support for placing Mlabri with the Tin languages, and regard the Htin as the most likely source if the Mlabri did give up farming for hunting and gathering. In the Mlabri, positions as much as a million letters apart on a chromosome are still inherited together, whereas in every other population compared the effect fades within about 200,000. The same study finds less genetic variation among the Mlabri than in any of the other sixteen populations. Combined with an estimated breeding population of 29 people, it interprets this as evidence of descent from a very small founding group. When the ancestry of all seventeen populations was divided into four parts, one part, chosen by the analysts, was found in every Mlabri but in none of the others.
The study qualifies its conclusion in one respect. The Htin it sampled speak Mal, one of the two varieties of Tin, so which variety the Mlabri came from cannot be determined without sampling both. The Mlabri samples used in that study, the survey of complete maternal genomes, and the earlier study of a shorter stretch of mitochondrial DNA all came from the same collection made in Nan province.
Monic branch
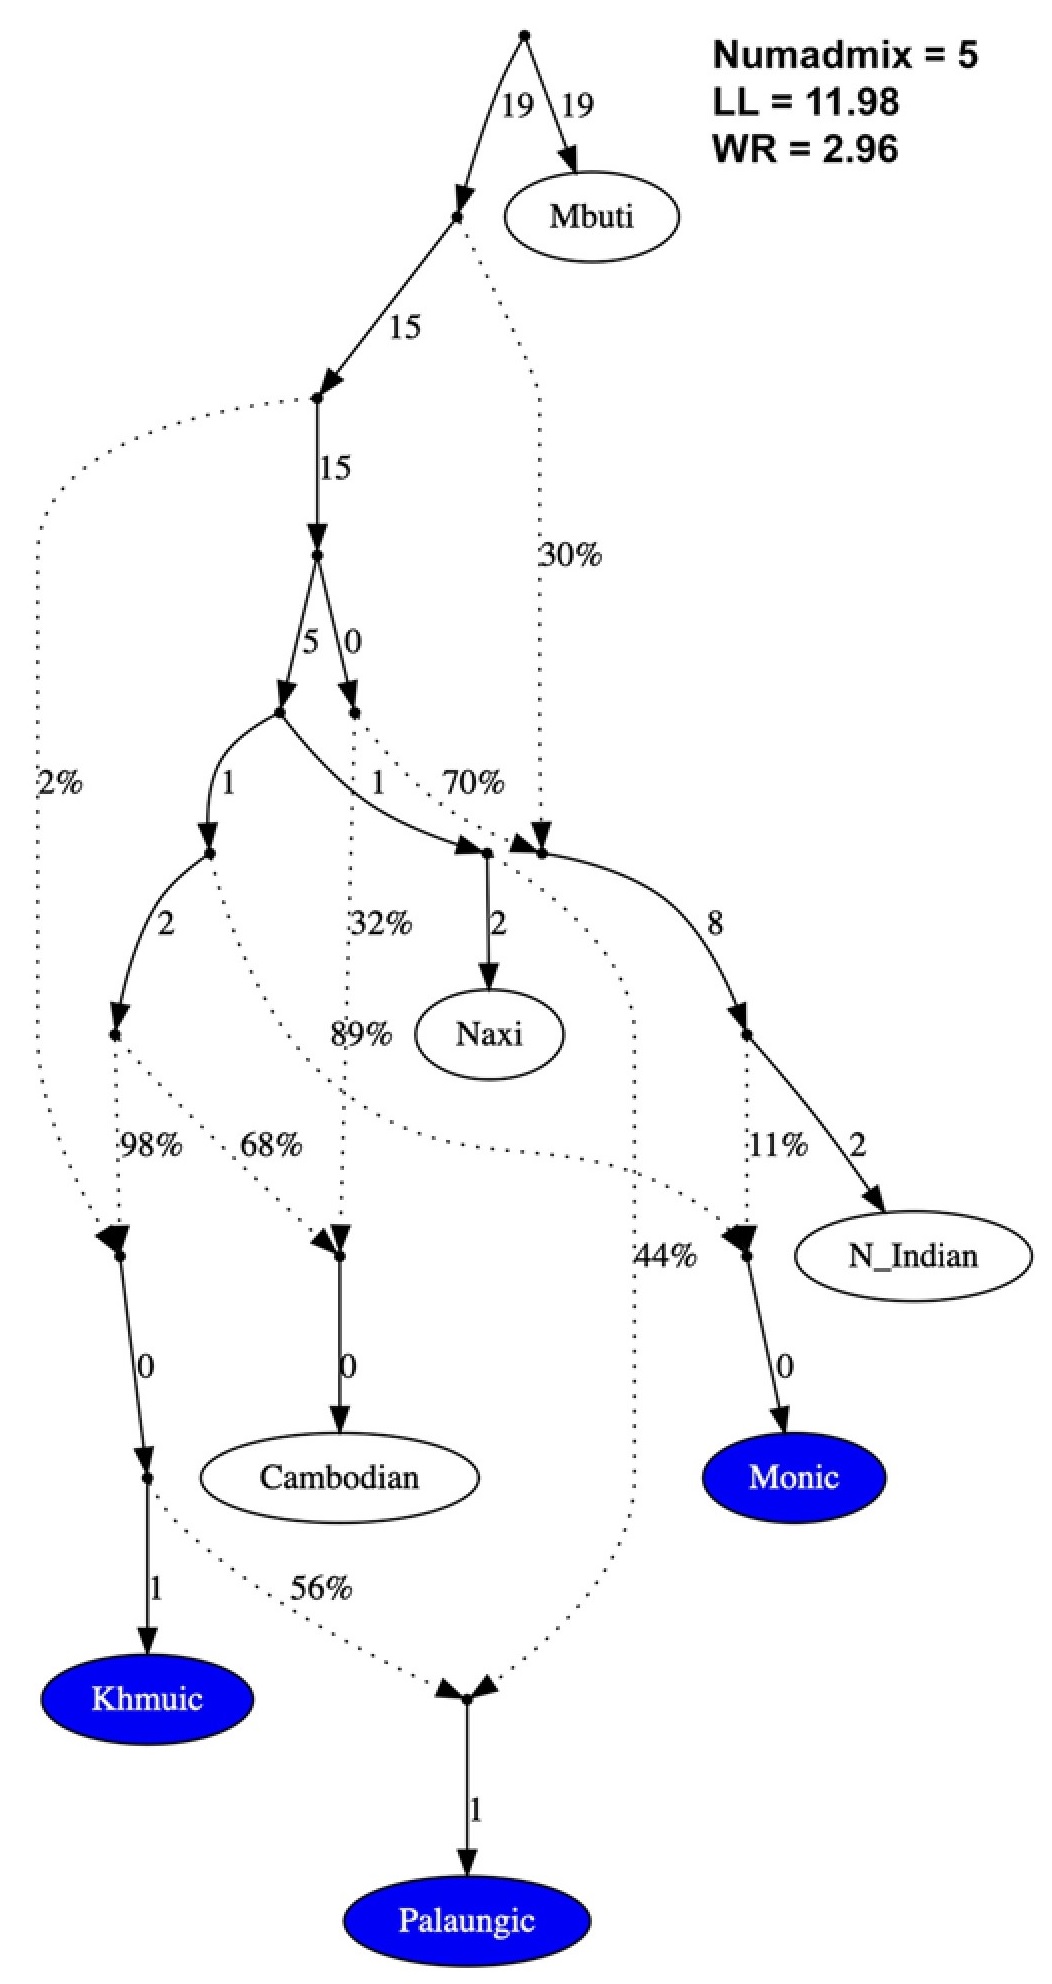
The Nyah Kur and the Mon are not genetically alike, although the Nyah Kur language descends from that of the Mon of Dvaravati. The Nyah Kur sampled in Chaiyaphum carry the narrowest range of variation among the 26 populations compared and sit at the edge of the comparison. The study attributes this difference to the Mon having reached Thailand from Myanmar between the sixteenth and nineteenth centuries, long after the Nyah Kur. An earlier survey of the northeast likewise found no maternal link between the two, and attributed the narrow range in its Chaiyaphum sample to marriage within a culturally isolated community. The Nyah Kur share no sequence with any sampled Mon population, but share sequences on both maternal and paternal lines with the Khmer.
Five Mon populations and two Nyah Kur populations have been compared on the maternal line, using 259 sequences in all. The five Mon and two Nyah Kur share very few maternal lineages. The study interprets this as evidence that they descend from different Monic populations: the modern Mon from groups that left Myanmar within the last few centuries, and the Nyah Kur from the Dvaravati population of central Thailand. The two Nyah Kur populations are not alike either. The Chaiyaphum sample falls among other Austroasiatic-speaking populations and has the narrowest range of maternal lineages of the seven, while the Nakhon Ratchasima sample falls among Tai-Kadai-speaking groups and has the widest. The study interprets the difference as an older Monic maternal line surviving in the first population but being displaced by intermarriage in the second. The Nakhon Ratchasima sample consists of 20 people from Pak Thong Chai district, collected for an earlier study. In that study, the same people fell beside two prehistoric samples from the province and apart from every Tai-Kadai population compared. The two comparisons used different sets of populations.
The five Mon populations are scattered rather than forming a single group. The samples from Ratchaburi and Nakhon Ratchasima are the closest pair and the only pair of the seven that does not differ significantly. The study interprets this as evidence of arrival in one wave followed by separation. The Mon of Kanchanaburi are closest to the Burmese and Karen, while those of Lamphun are closest to their Tai-Kadai-speaking neighbours. The authors could not explain why the central and northeastern Mon are closer to northern Austroasiatic-speaking groups than to the Mon of the west. Maternal population sizes were stable or increasing in all seven populations until a decline between about 5,000 and 1,000 years ago, with the Nakhon Ratchasima Mon as the exception.
Affinities of the Mon
Of the Thai populations compared in one survey of maternal lineages, the Mon share the largest proportion of lineages with South Asian populations, about a third. The same study reports a Tibeto-Burman component in the Mon that it does not find in the other Thai groups tested, and connects it to contact with Sino-Tibetan-speaking populations in Myanmar. Haplogroup W3a1b, not previously reported in mainland Southeast Asia, was found in 24 percent of one Mon sample of 25 and 4.35 percent of another of 23. Haplogroup D4, also common in South Asia, reaches 28 percent in the first of those samples and about 32 percent in a third sample of 22. Those two samples are closer to populations of Myanmar and India than to the other three Mon samples or to any other population tested in Thailand. Two further Mon samples carry maternal lineages characteristic of South Asia and the Near East, including M6a1a, M30, M40a1, M45a and I1b. One of the two again falls with Indian, Myanmar and Cambodian populations rather than with Thai and Lao ones. Male lineages show a similar pattern. The Mon sampled carry lineages otherwise found in South and Central Asia, including R, H, J, L and Q, and on both maternal and paternal lines they are closer to the Tai-Kadai-speaking populations than to the other Austroasiatic ones.
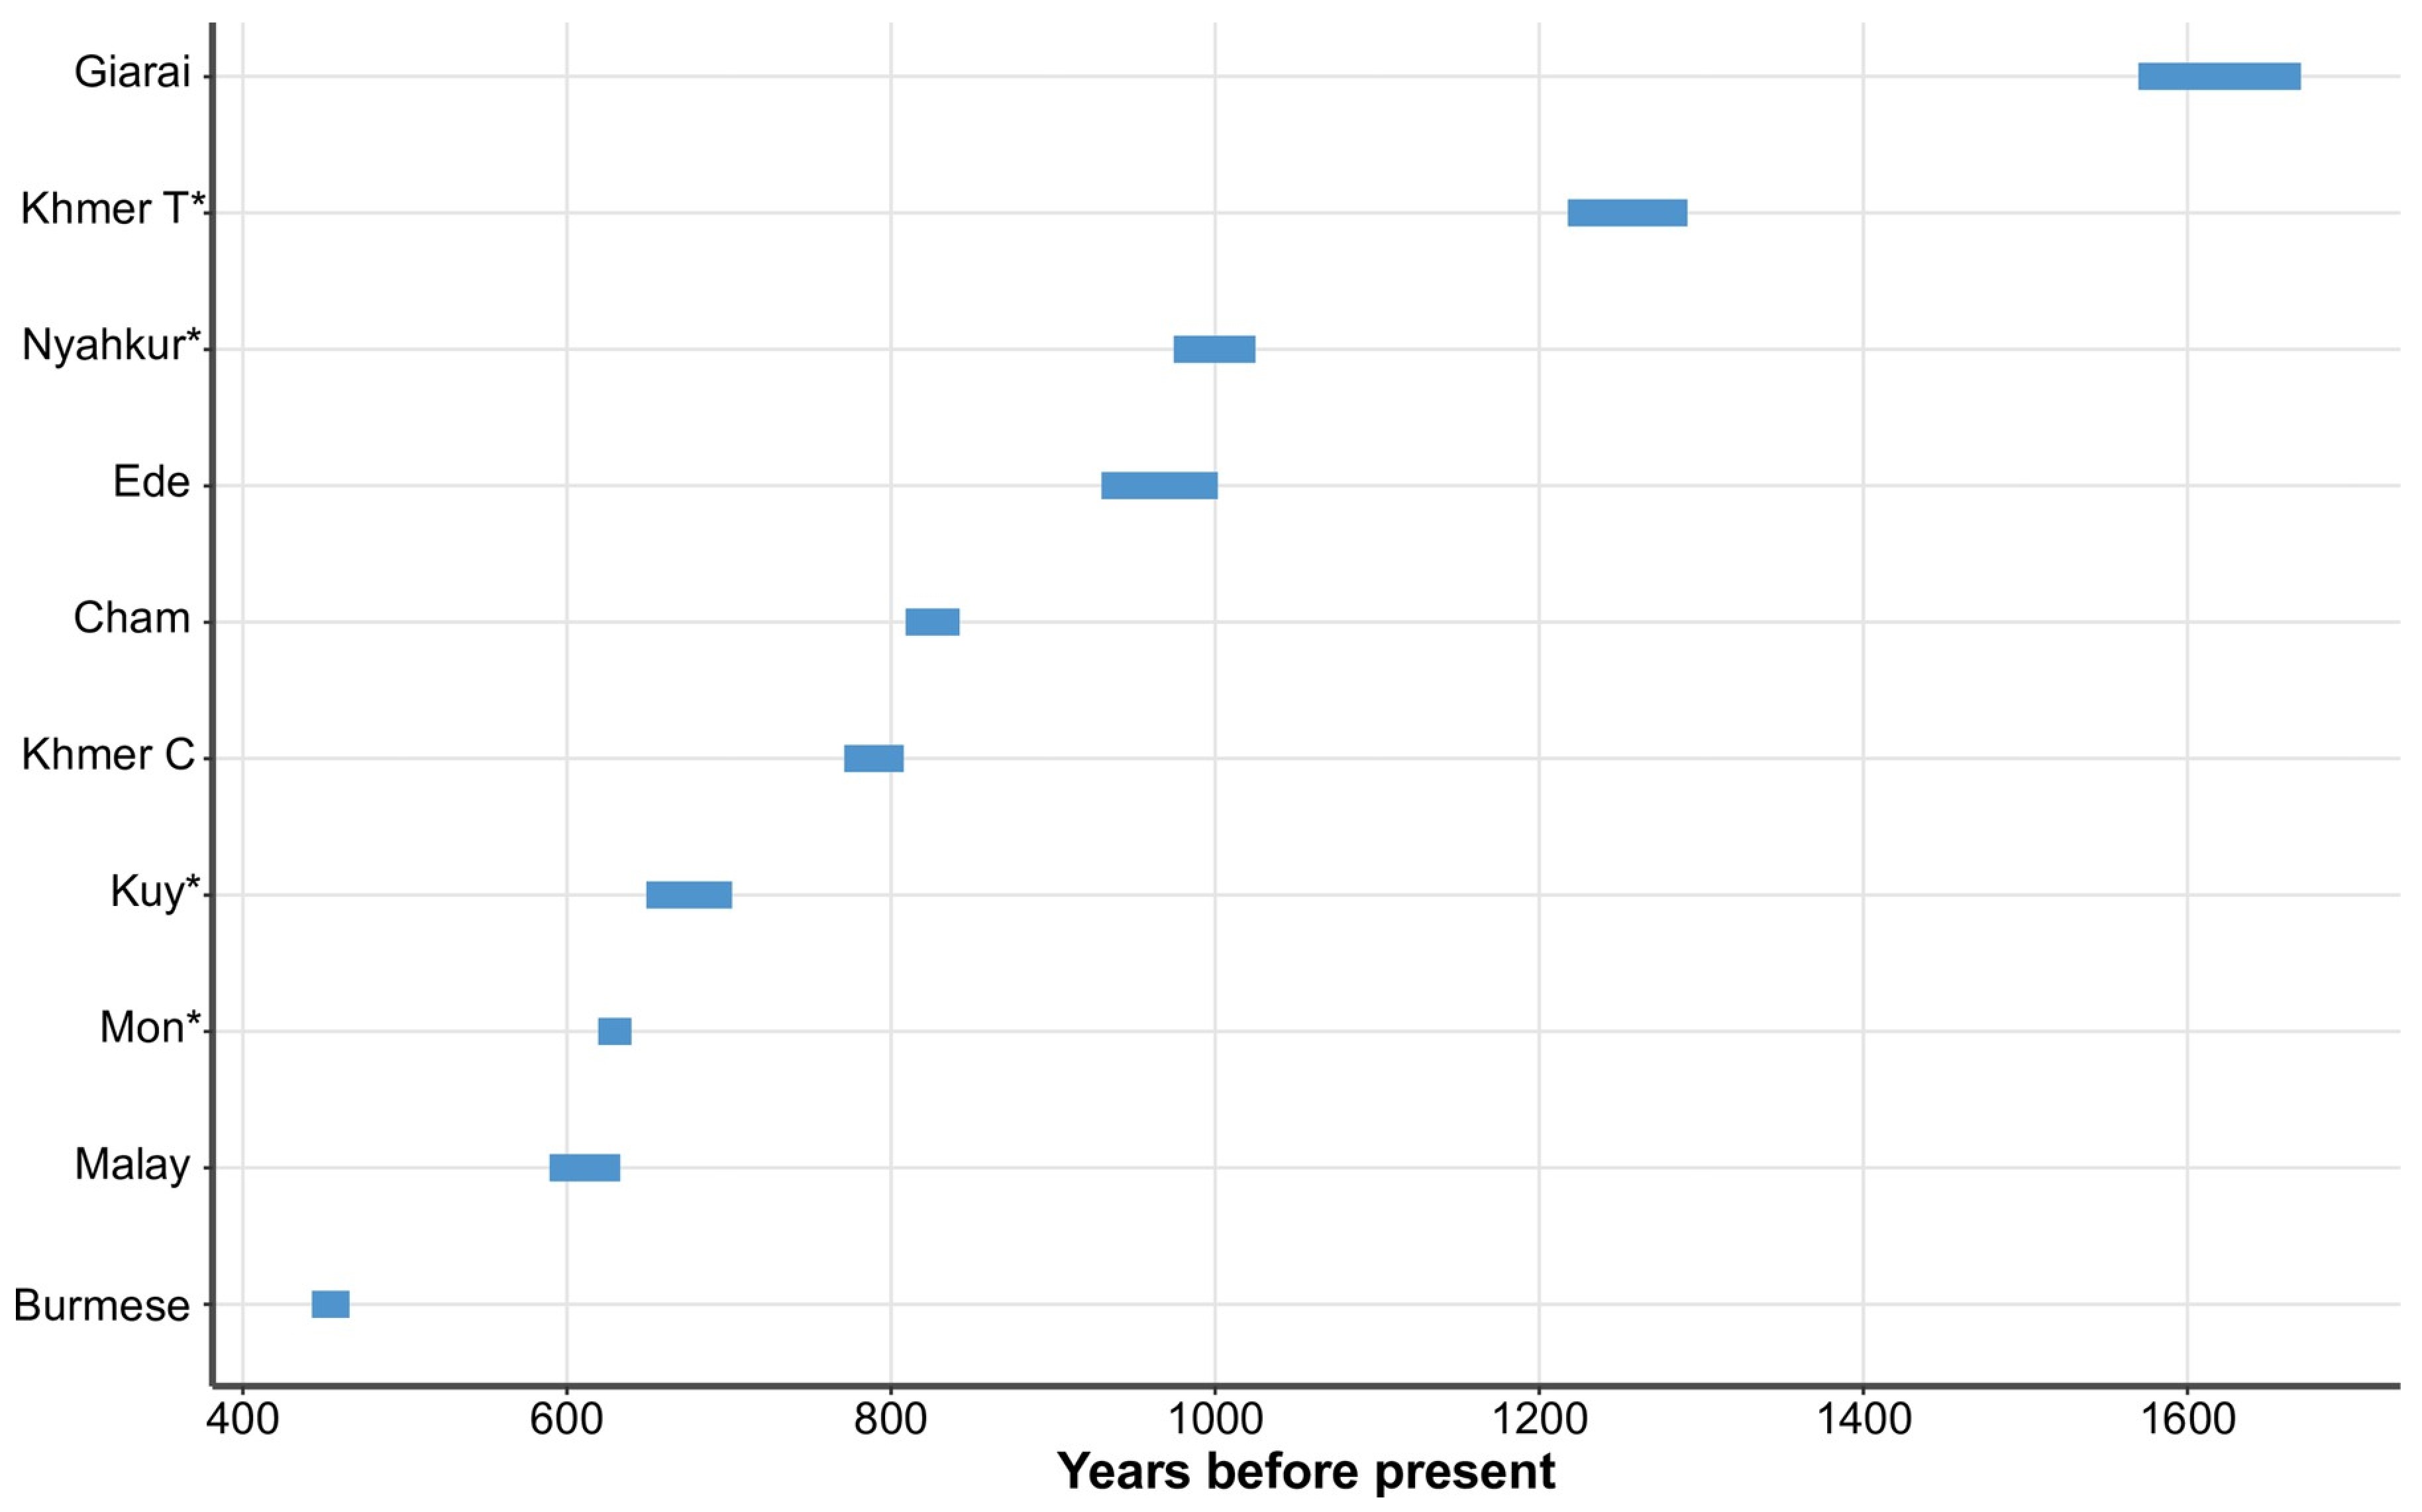 The Mon sampled at Lamphun in the north differ little from Mon sampled in central Thailand. Both fall with the central Thai, southern Thai and Lao Isan populations rather than with the other Austroasiatic groups of the north, a separation the study attributes to ancestry related to South Asia. Genome-wide data put that ancestry at about 11.6 percent in a Mon sample and 7 percent in a Nyah Kur sample, and find a Tibetan-related component in the former that is absent from the latter. The study interprets this component as evidence of contact with Sino-Tibetan-speaking populations in Myanmar. It takes the finding as favouring a Mon origin in Lamphun through migration from Myanmar within the last few centuries, rather than direct descent from the Mon of Dvaravati and Haripunjaya. Its estimates for South Asian admixture in the Nyah Kur fall within the Dvaravati period. In a tree of Asian populations built from thirteen repeated sequences, the sampled Mon of Thailand fall between Burmese samples from Yangon and Mandalay.
On the maternal line, the Mon sampled in the north fall among the Tai-speaking populations rather than with the other Austroasiatic ones. One study connects this pattern to accounts of Tai men marrying Mon women. Its authors note that more markers and larger samples would be needed to determine whether this explains the pattern.
Katuic and Palaungic branches

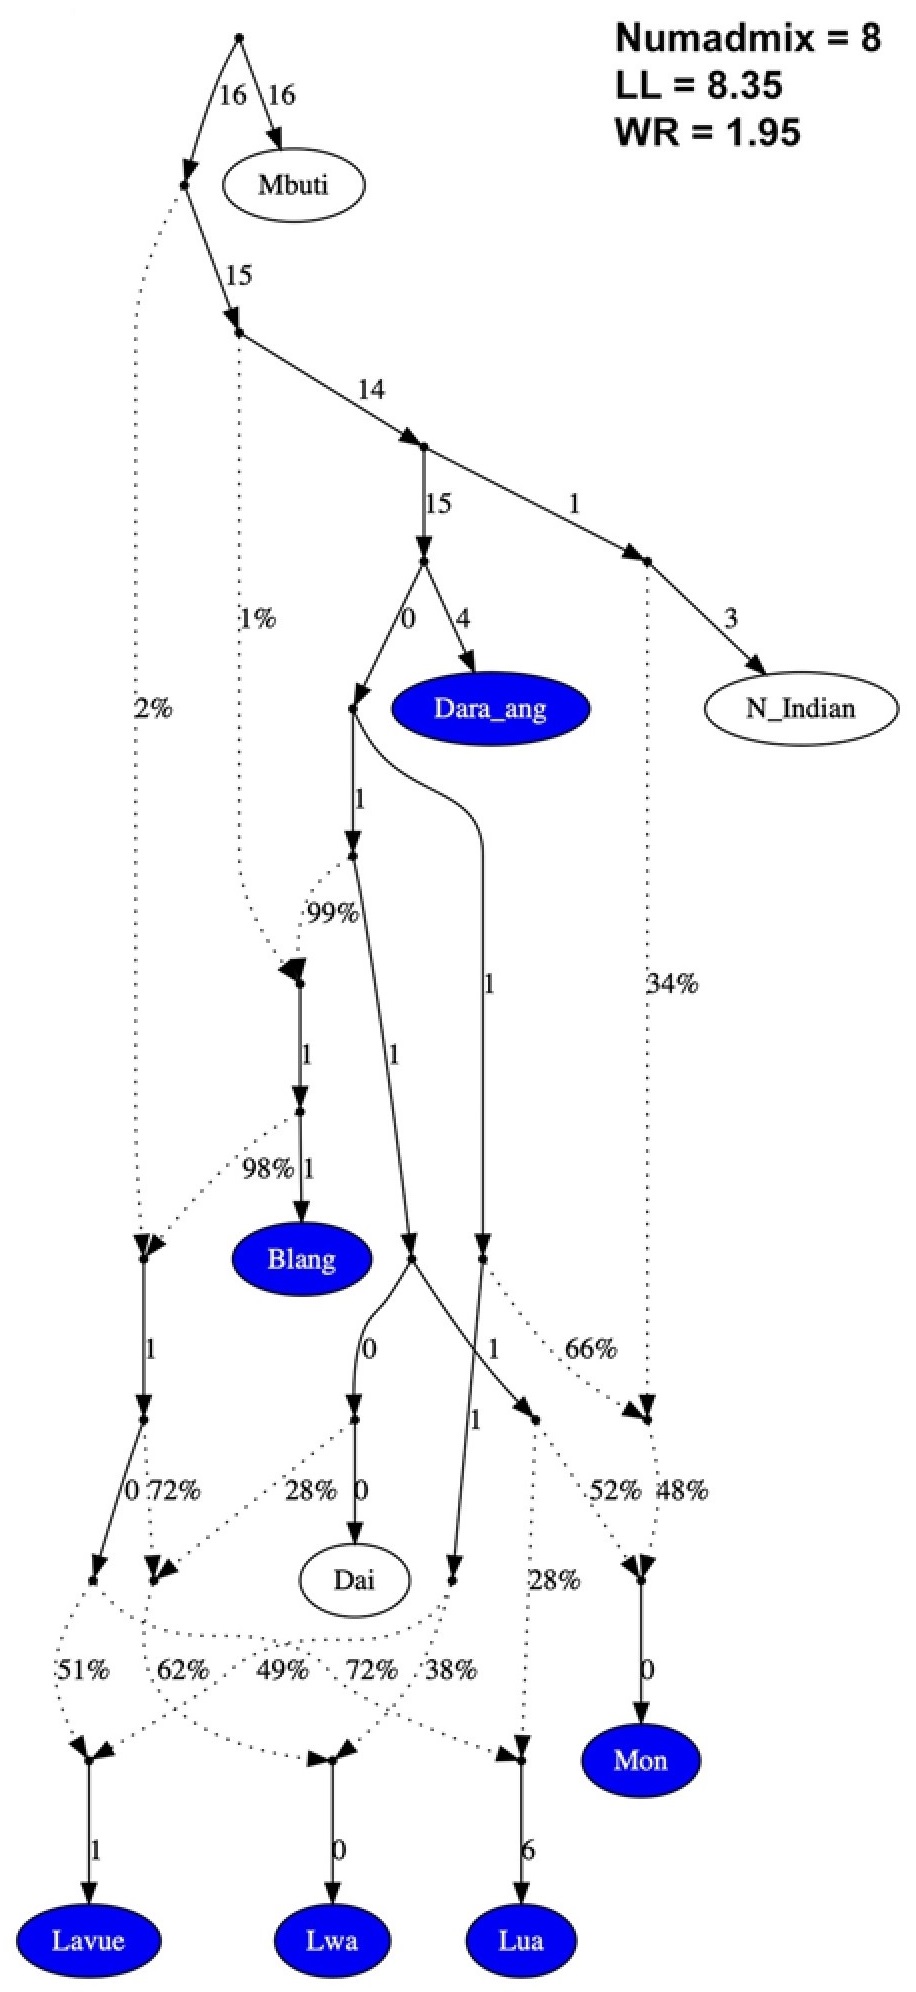
The Lawa of Chiang Mai and Mae Hong Son, known to Thai speakers as Lua or Lawa, use two names for themselves: Lavue in the mountains and Lwa in the lowland river plains. The two correspond to the Western and Eastern Lawa languages. Among 89 people sampled from five villages, the two differ in genetic make-up. The Lavue carry the ancestry common among Austroasiatic speakers together with a component common in Sino-Tibetan-speaking groups such as the Karen, but little from the Tai-Kadai populations around them. The Lwa and the Blang also carry the Tai-Kadai component. In a model of population splitting and mixing, the Lwa were fitted as about 38 percent from an Austroasiatic-related source and 62 percent from one related to the Dai of southern China. The Lavue were fitted in the same model as a mixture of an earlier Lavue-related source and a Karen-related one, at about 83 and 17 percent, respectively.
Neither the name a community uses nor the classification of its speech follows this division exactly. The people of Bo Luang in Chiang Mai call themselves Lavue but speak Eastern Lawa and resemble the Lwa. The study instead finds the pattern associated with where a community lives and which rites it observes. The villages that centre their ceremonies on a sacred pillar carry the least Tai-Kadai ancestry.
The Lawa are divided among themselves in a way that follows a documented history. Some sampled villages draw on a single ancestry, while others draw on several. After the Tai took the region in the late thirteenth century, the Lawa were dispersed, with some moving into the mountains of Mae Hong Son and others settling closer to Tai populations. The study interprets the present differences as the result of founder groups carrying unequal shares of an earlier population.
Three Lawa villages have been compared on the maternal line, with 137 people carrying 44 distinct sequences. Differences between the villages account for about 4 percent of the variation, with the rest occurring within them, although all three still differ significantly from one another. One village, Ban Pa Pae in Mae Sariang district, has the narrowest range of sequences and lacks the signal of past population growth found in the other two. The study attributes this to descent from a founding group small enough to have carried only part of the variation of the population it left. All three are closer to other Austroasiatic-speaking populations than to any Tai-speaking population. The study interprets this as evidence of little maternal exchange with the Tai despite their long shared occupation of the Chiang Mai and Lamphun basin.
The Palaung, although Austroasiatic speakers, fall closer to the Sino-Tibetan cluster than the other Austroasiatic groups do. The study connects this to their ancestors settling the upper Salween before most other populations reached Myanmar. The people call themselves Dara-ang and are the most distinct of the Palaungic-speaking groups sampled in the north. They also carry a small share of an ancestry otherwise found in the Andaman Islands and among hunter-gatherer communities in India. A comparison with ancient samples did not confirm this connection, which the authors attribute either to the small size of the component or to the limited ancient record for the region.
Two Austroasiatic groups stand out through their connections with neighbouring populations rather than through isolation. The Kuy share more of their genome with the Khmer than with any other sampled population, consistent with long-standing linguistic evidence of contact between the two. The Palaung of the northwest carry ancestry related to South Asia, which the study reporting it dates to between 600 and 660 years ago. A genome-wide study estimates that a sampled Kuy population carries about 4.3 percent of the same ancestry and dates the admixture to between 649 and 702 years ago. The same study finds a Tibetan-related component in the sampled Lawa and interprets it as having reached them through the S'gaw Karen. The S'gaw Karen began moving into Lawa country from Myanmar around 1850, and the two groups now share villages and intermarry.
Aslian branch

The Maniq of the far south are the other group in Thailand recorded as living by hunting and gathering. Eleven complete mitochondrial genomes carry three lineages that branch early in the human family tree, M17a, M21a and R21, while four Y chromosomes carry a single lineage, haplogroup K. Two of the three maternal lineages have also been reported in groups in Malaysia, and the Maniq are closest to the Jehai there rather than to any population sampled in Thailand. The study interprets them as descendants of the peninsula's earliest inhabitants and attributes their narrow range of variation to the expansion of farming populations into the region.
Five further Maniq genomes carry four copies of lineage M21a, common among hunter-gatherer and Proto-Malay populations of the Malay Peninsula, and one of B4g. The latter is interpreted as evidence of mixing with East Asian populations, consistent with a genome-wide estimate of about one third East Asian-related ancestry in the group. The Maniq and the Jehai do not differ significantly on the maternal line.
Genome-wide data fit about 74 percent of the ancestry of a sample of nine Maniq to a deeply diverged East Eurasian source, and the remainder to one related to the Atayal of Taiwan. About nine tenths of the sample's genome is covered by stretches shared with other Maniq, which the authors interpret as evidence of recent and intense genetic drift in a small population.
Fifteen repeated sequences typed in 15 Maniq give the narrowest range of variation among the 17 Thai and Malaysian populations compared and separate the Maniq from every one of them. On the same marker set, however, they carry more variation than the Mlabri of the north, who have the least among about 70 Thai populations. In a tree of 29 Asian populations built from those markers, the Maniq branch is the longest. The study attributes this pattern to chance changes and marriage within a very small and isolated community. Between the Maniq and the Mlabri, the pattern is reversed on the two lines: the Maniq carry more variation on the maternal line, while the Mlabri carry more on the paternal line.
Sino-Tibetan groups
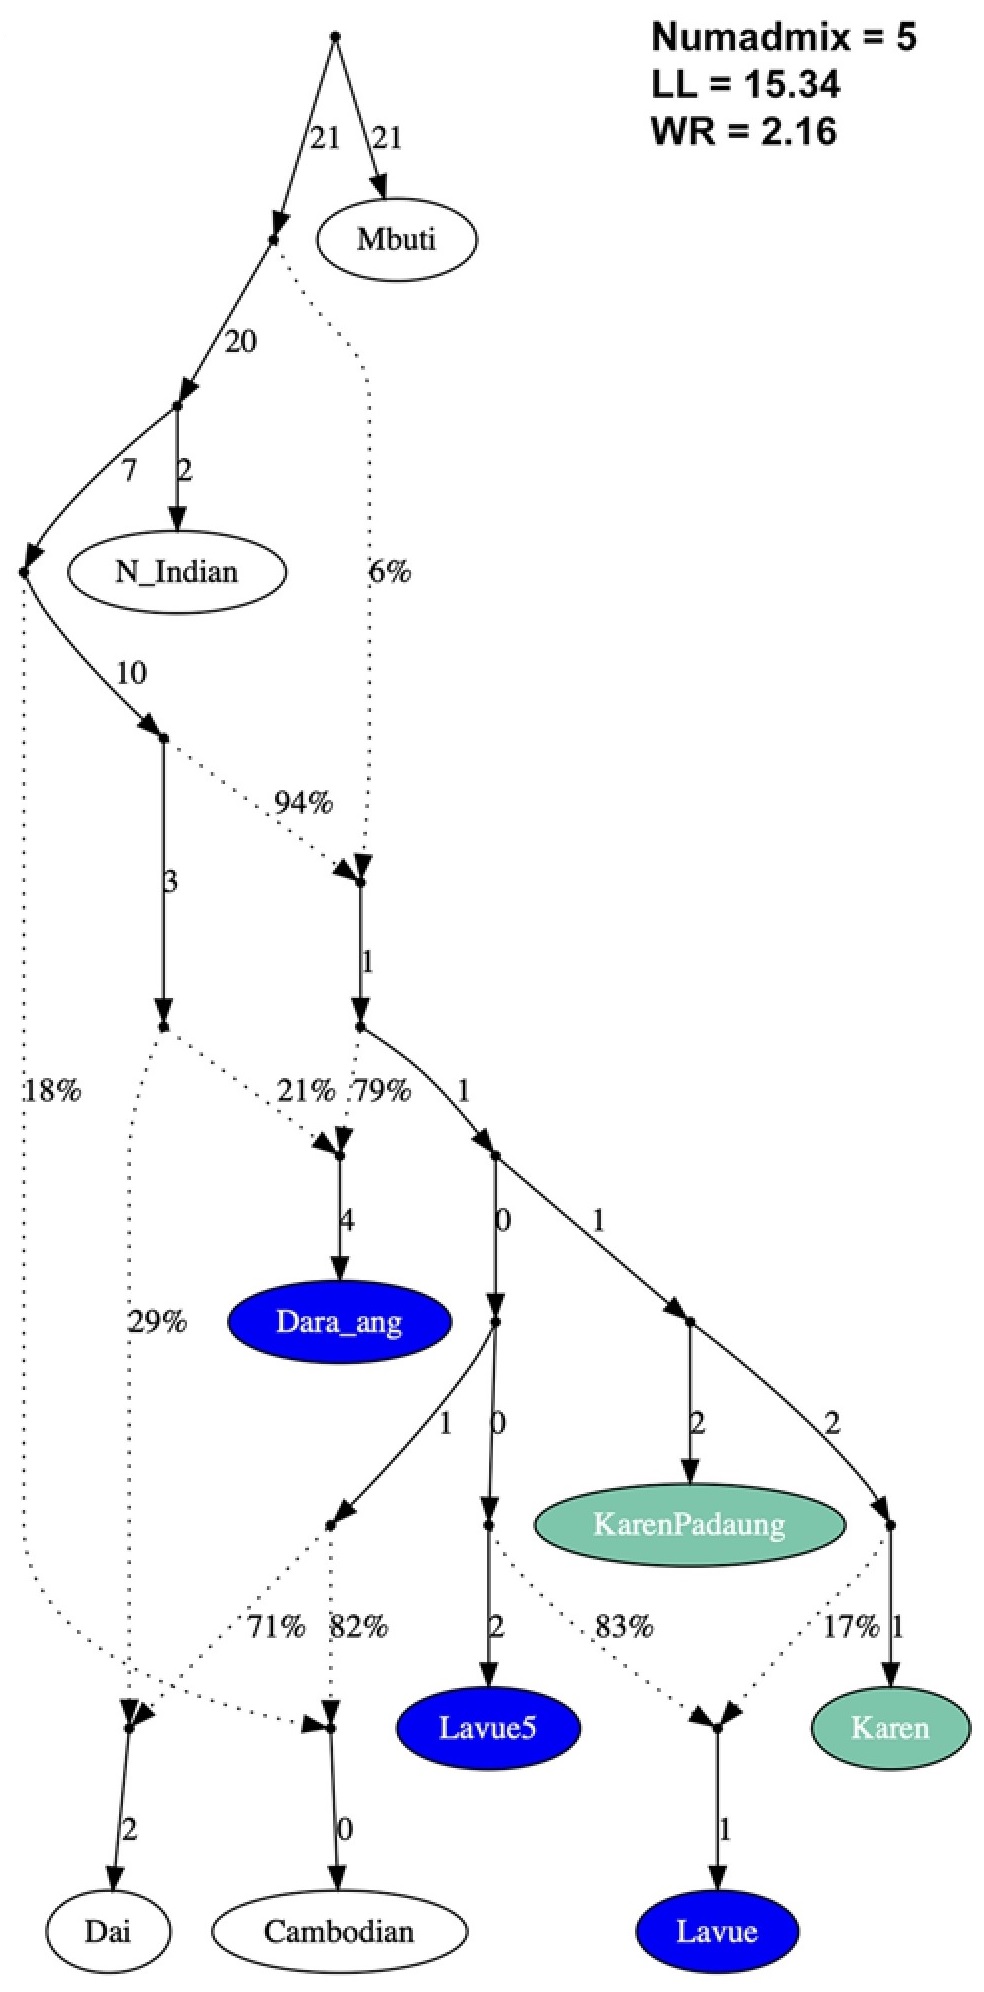
Two Sino-Tibetan groups differ from the rest. The two sampled Lahu villages resemble each other and differ from all the other populations, while the Akha, Lisu and one Karen group fall closer to the Tai-Kadai and Palaungic populations.
A sampled Akha population shares chromosome segments with several Tibeto-Burman-speaking populations, most strongly with the Yi. Other groups carrying this ancestry in the same study draw most of it from the Sherpa. The study models the sampled S'gaw Karen as a mixture of a Tibetan-related source and a Mlabri-related one. In an early survey of the maternal molecule, the Lisu and Lahu sampled together at Chiang Dao in Chiang Mai are almost indistinguishable. Six of the ten sequence types found among the 21 Lahu occur only in that sample, the lowest proportion among the eight populations compared. The study interprets this as evidence of gene flow from surrounding populations.
On the maternal line, each sampled Karen population is dominated by a few lineages. Three account for 84 percent of one sample of 25 and four for 56 percent of another, while the four populations sampled share sequences with one another. Their maternal ancestry contains both northeast and southeast Asian elements, with the former represented by lineages C and A that are otherwise common farther north. Two of their more common lineages show shared sequences rather than the branching pattern expected from population growth, which the study interprets as evidence of a decline in population size. Four Karen populations have been sequenced on the paternal line: two S'gaw, one Pwo and one Padaung. None shows the pattern associated with recent population growth on either line.
Two Karen subgroups carry a paternal lineage not found in any of the other populations compared. G-M285 occurs in 4 of 24 sampled S'gaw Karen and 4 of 15 sampled Pwo Karen, but in none of the six other northern populations in the survey. The lineage is common in West Asia and on the Central Asian steppe. The study calls the finding unexplained and says that broader sampling and deeper testing are needed before any conclusion can be drawn from it.
Hmong-Mien groups
The Hmong are the opposite case among the highland groups. They resemble one another across the five sampled villages and differ from every other population tested, from the broadest division onward. The study connects this pattern to marriage within the group, which extends clan networks and widens the pool of potential partners within a village. The Iu Mien, who speak a related language, show the opposite pattern. They fall near the centre of the same comparisons and differ significantly from relatively few of the surrounding populations. Ethnographic accounts from the 1960s report that between a tenth and a fifth of adult Iu Mien had been adopted from other highland and lowland groups. Genome-wide data could not fit a sampled Hmong population to any of three standard comparison populations as a single source. Instead, it was fitted as a mixture of the Miao of China and a deeply diverged East Eurasian source. Hmong sampled in Thailand and Vietnam could not be distinguished from one another, which the authors interpret as evidence of continuity between the two populations.
Austronesian groups
Chao Lay
The Moken, Moklen and Urak Lawoi of the Andaman coast number about 12,000 between them and are known collectively as Chao Lay. Their paternal lines have been studied using seventeen repeated sequences in 10 Urak Lawoi men and 13 Moklen, together with 11 Moken from an earlier study. The Moken and Moklen do not differ significantly from one another and sit apart from every other population in the comparison. The Urak Lawoi instead fall with the southern Thai and Austronesian-speaking populations of Malaysia and the Philippines. The study interprets the first two as having closer connections to mainland Southeast Asia. The Moklen have the narrowest range of paternal variation of any Thai population compared, although the study notes the small sample as a limitation.
On the maternal line, 205 complete mitochondrial genomes have been obtained from eight southern populations, 98 of them newly sequenced. The Chao Lay carry less maternal variation than the southern Thai populations around them and show none of the recent population growth seen in every southern Thai group. A few lineages account for most of each population. D4e1a, F1a1c1, M21b2 and M46a account for 97.30 percent of the 37 Moken sampled on Chang Island in Ranong province, and the study attributes the narrow range to a community of about 200 people. E1a1a1a, F1a1a1, M21b2 and M50a1 account for 92.59 percent of the 27 Moklen.
On the maternal line, the grouping is reversed: the Moklen fall with the Urak Lawoi rather than the Moken, and the two do not differ significantly, while both Moken samples differ from them. The authors of the paternal study interpret this as evidence that the male and female lines of the Moklen have different histories. They also note that the paternal grouping follows the linguistic classification, which separates Moken and Moklen from Urak Lawoi. This contrasts with a cultural grouping that pairs Moklen with Urak Lawoi on the basis of settled life and boat type. The paternal study used DNA from the same collection as the maternal study, so the two results are based on one set of samples analysed using two marker systems.
Repeated sequences on the other chromosomes give a third picture, and the first genetic evidence of this kind for two of the three groups. In a clustering analysis of sixteen populations, the Moklen and Urak Lawoi share a component of their own that no other population carries in comparable amounts. The Moklen also carry components common among the populations around them, unlike the Urak Lawoi. The study interprets this as evidence of mixing between the Moklen and their neighbours. It compares this with the ethnographic record, in which the Urak Lawoi remained more separate while the Moklen had regular contact with other southern Thai populations. Both carry less variation than the other Thai and Malaysian populations compared. Only four Moken were typed, and the study considers this sample too small for comparison.
Links with island Southeast Asia
Two maternal lineages not previously recorded in Thailand were found among the 23 Nayu women sampled. One woman carried haplogroup Q3, whose closest known match is a sequence from East Timor and whose wider branch is otherwise confined to New Guinea and nearby islands. The other, E1a1a1, is common in Taiwan and island Southeast Asia. Two further lineages in the southern samples, B4a1a and M7c1c3, are otherwise found mainly in Taiwan and island Southeast Asia. The study reads these findings as evidence of contact between the mainland and the islands that had not previously been detected in Thai and Lao maternal data.
One maternal lineage also links the group to the spread of Austronesian languages. E1a1a1a, common in Taiwan and island Southeast Asia, was found in 22.22 percent of the 27 Moklen and in one individual from the second Moken sample. The Chao Lay branch of this lineage is dated to about 2,760 years ago, which the study associates with the period of the Austronesian expansion. Both studies nevertheless place the Chao Lay closer to mainland Southeast Asia than to the islands. The maternal study offers another possibility: that the group originated in Taiwan or island Southeast Asia and acquired mainland ancestry after arrival. Its authors note that they sampled only a small part of the Chao Lay communities and examined the maternal line alone.
Whether such lineages reached the mainland at all was answered differently by an earlier, more northerly set of samples. Five maternal lineages associated with the Austronesian expansion from Taiwan, including E1a1a and B4a1a1a, were absent from 1,794 genomes from Thailand and Laos. The authors therefore considered that the expansion had reached mainland Southeast Asia little, if at all, while allowing that its lineages may have arrived but failed to survive. The southern samples in which one of the five was later found were sequenced after that survey.
Ancient DNA and bioarchaeology
Ancient DNA has been recovered from human remains in Thailand through a small number of projects. Other studies reuse genomes published by those projects but give no radiocarbon date or laboratory identifier for the remains they analyse. What follows is evidence about earlier populations of the region rather than about any population living today.
Hunter-gatherers and the arrival of farming
One project sequenced 26 ancient genomes from across the region, including individuals from northwestern Thailand. It tests the two main accounts that had been proposed for the arrival of farming and finds that neither fits the genetic evidence. The first held that local hunter-gatherers adopted farming with little outside contribution; the second proposed that farmers from East Asia replaced them about 4,000 years ago. Ancestry does change around that time, but the newcomers mixed with the people already living there rather than replacing them. The study reads present-day populations of the region as drawing ancestry from at least four earlier populations.
Remains of the hunter-gatherers who lived in the region before farming, known as the Hoabinhian, are closest to the Onge of the Andaman Islands. Their contribution to the ancestry of later populations declines over time, from between a third and a half in the farming period to under a quarter by the Iron Age. For three groups, including the Iron Age population from Long Long Rak in northwestern Thailand, no such ancestry is needed in the model. This has been interpreted either as complete replacement of the earlier population or as the arrival of newcomers who had not yet mixed with local people.
Neolithic to Iron Age cemeteries
The first ancient DNA recovered in Thailand came from two prehistoric cemeteries about 10 kilometres apart in the Upper Mun valley of Nakhon Ratchasima, Noen U-Loke and Ban Lum-Khao. Teeth from 26 skeletons at the first site and 16 at the second yielded usable maternal sequences for 17 and 13 individuals respectively. The sampled burials date to between 2,400 and 1,500 years before present at Noen U-Loke and between 3,200 and 2,400 at Ban Lum-Khao. No sequence occurs twice within either sample, unlike every living population in the same comparison, while one Ban Lum-Khao sequence exactly matches one from Noen U-Loke. The two sites are closer to each other than to any other population compared, and their nearest living match is the Nyah Kur, whose villages lie nearby. The study interprets this as a maternal lineage that has persisted locally since prehistoric times in a population that may have spoken an Austroasiatic language. The Thai-Korat of the same district come next. The study regards them as possibly carrying ancestry from the earlier inhabitants, while noting that they still group more closely with other Tai-Kadai populations than with either ancient sample. The Tai-Kadai samples as a whole fall apart from both prehistoric populations and from most Austroasiatic ones. Instead, they are closer to the Zhuang and southern Han populations, which the study considers consistent with arrival from southern China in the early second millennium AD.
Genomes have since been recovered from five people buried at Ban Chiang in the northeast, spanning the late Neolithic to the Iron Age, between about 3,500 and 2,400 years ago. They carried the maternal lineages F1f, B5a1a, B5a1c, M74b2 and M72a, while the two men could be assigned on the paternal line only to the deep branches CT and F. In overall genetic similarity, all five fall with present-day Austroasiatic-speaking groups, as do remains of the same period from Vietnam and Cambodia. They share more genetic variants with those groups than with any others compared. They also carry a high proportion of ancestry from a lineage that branched early in eastern Eurasia. The study interprets this pattern as evidence that farming reached mainland Southeast Asia with migrants from southern China who spoke early Austroasiatic languages. On this account, those migrants already carried between a quarter and a third of their ancestry from the region's earlier hunter-gatherers, acquired either in China or after their arrival. Coverage was low throughout, ranging from 0.005 to 0.030 of the targeted positions, and four of the five individuals were represented by a single sequencing library.
The strongest such link reported for any population in Thailand is between the Khmuic speakers and remains from the Tam Pa Ling and Tam Hang caves in northern Laos, dated to between about 3,100 and 2,400 years ago. The Lua and Mlabri show this link most clearly. All the Khmuic populations in a later comparison show the same link. The Lavue sampled at Dong village in Mae Hong Son are the only Palaungic group in that comparison with a significant link to Iron Age remains from the Tam Ya Pa Nhae site in the same province.
When ancient and living populations are compared, the earliest farming-period remains are consistent with a close relationship to today's lowland Austroasiatic groups, while the Iron Age remains are closer to the highland groups. Tai-Kadai populations are closer to ancient remains from East Asia than to those from Southeast Asia.
Pang Mapha log coffins
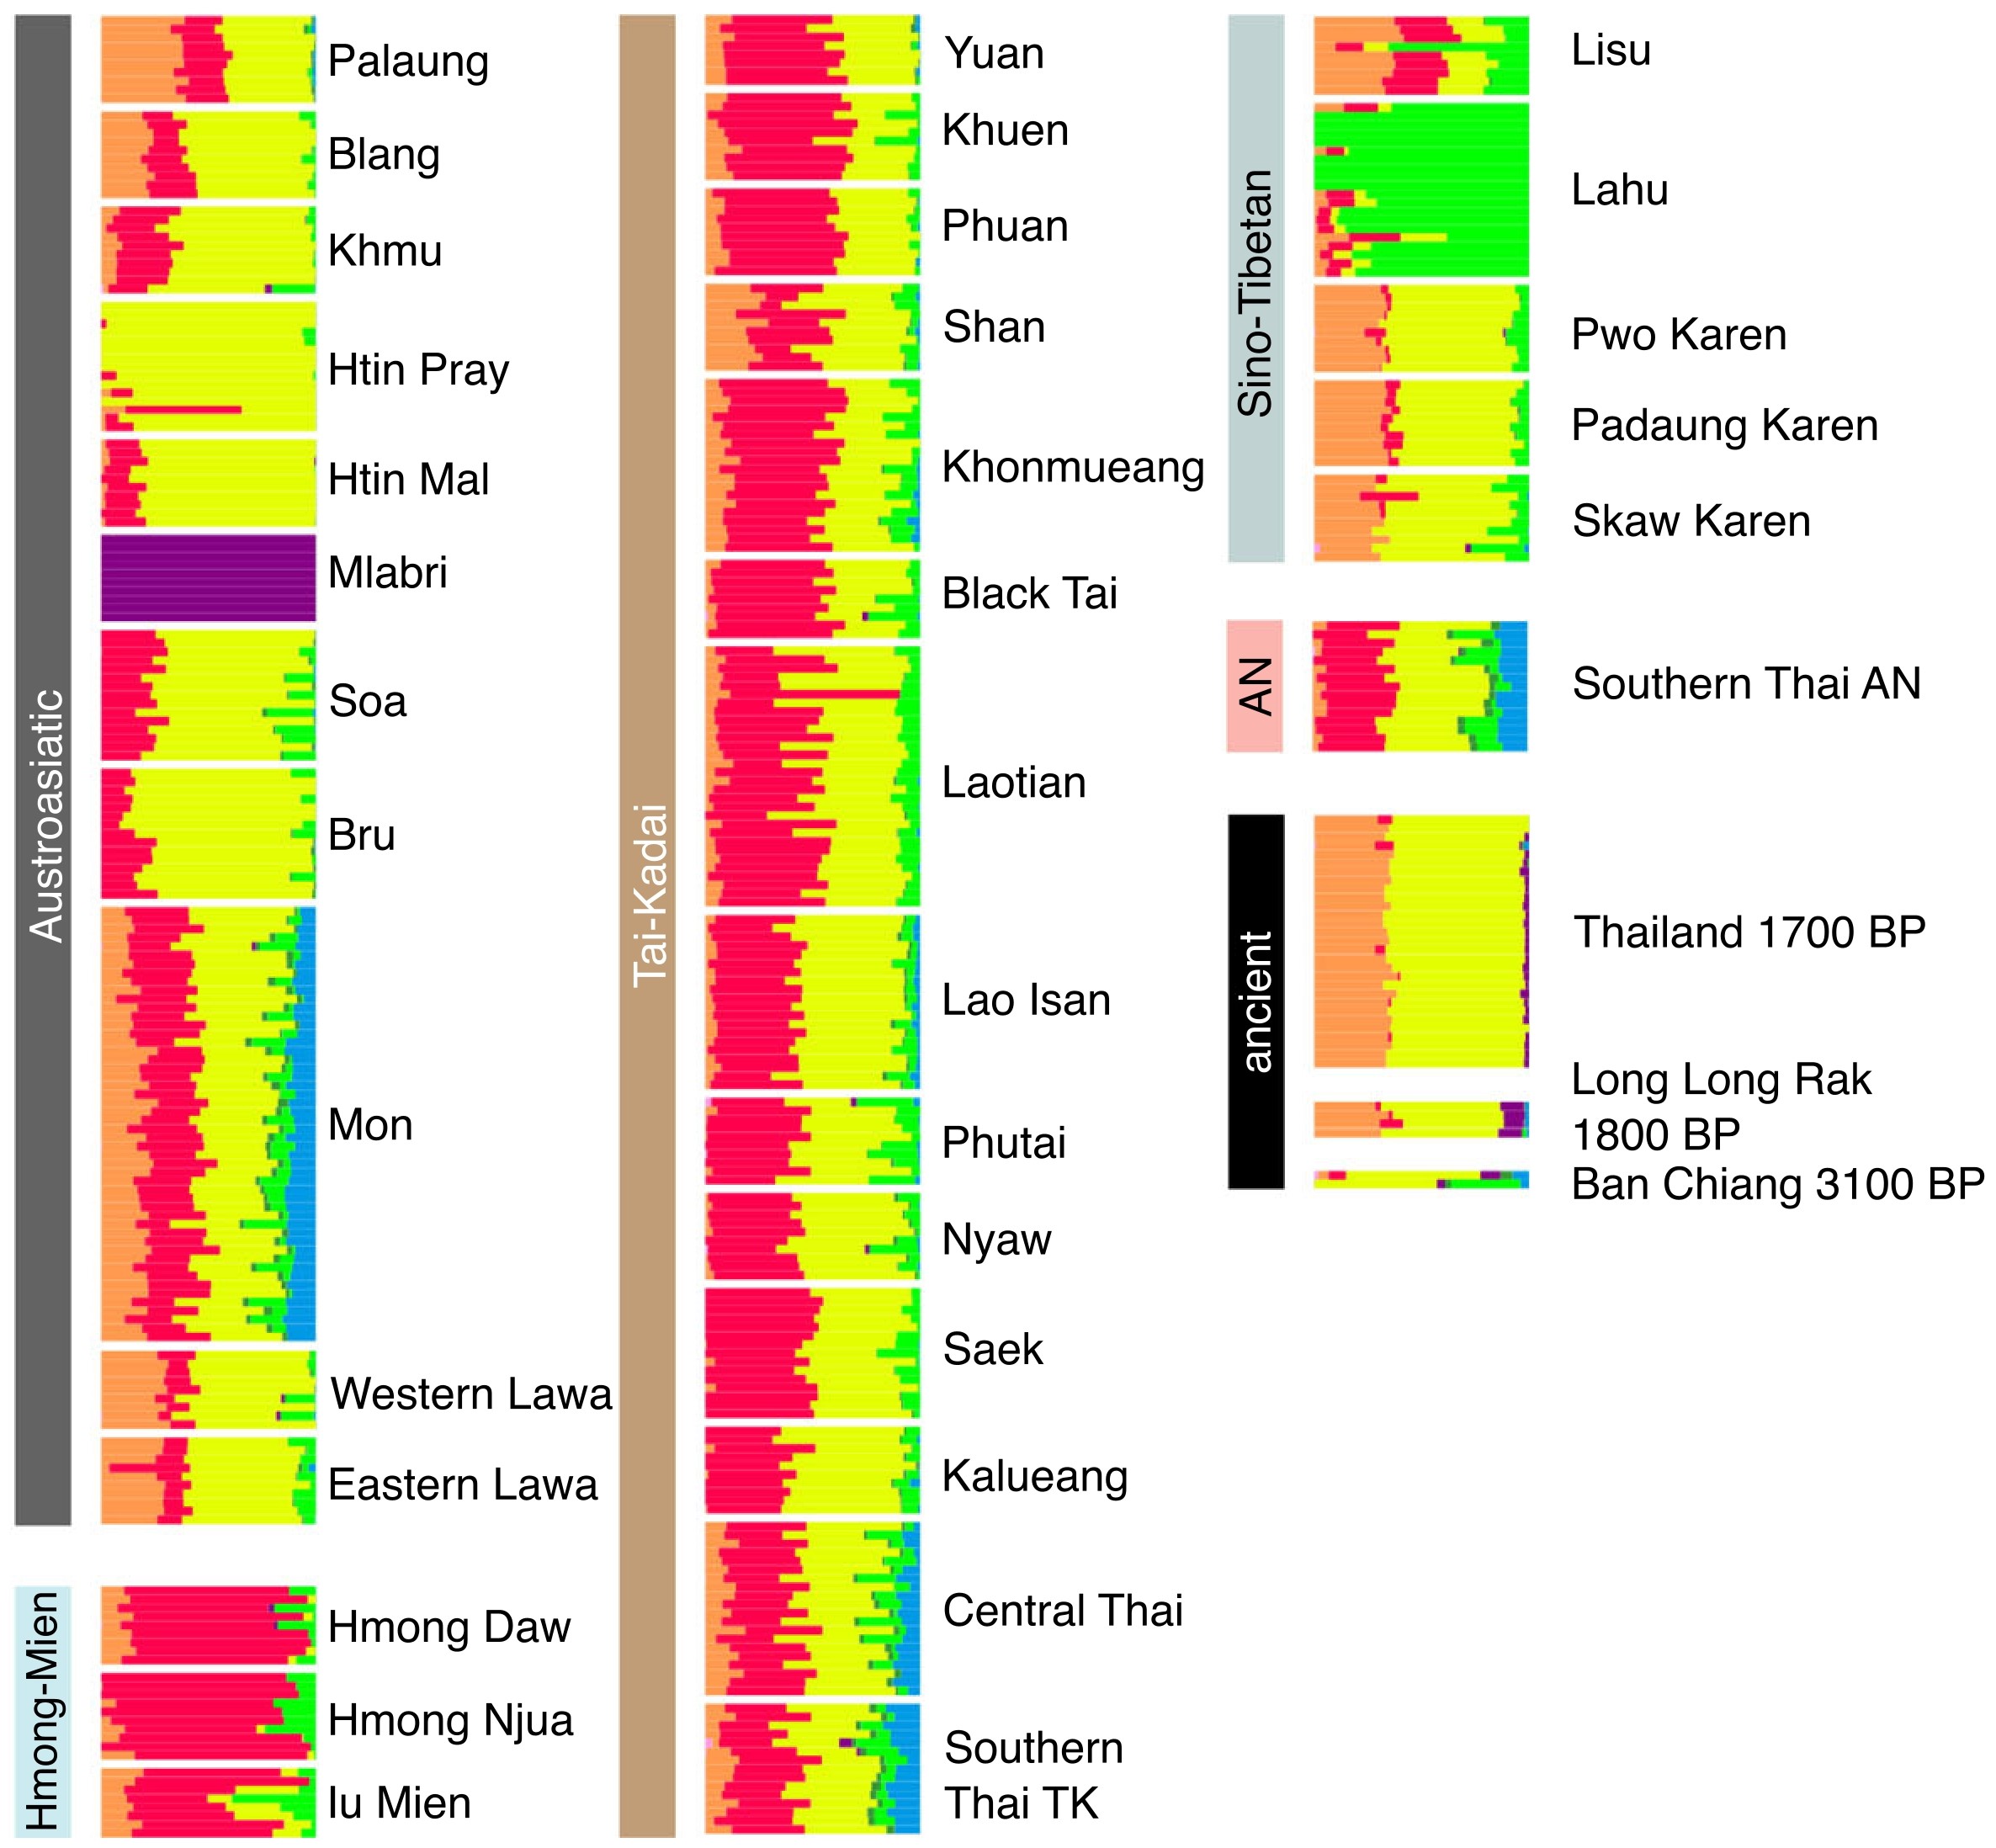
Thirty-three individuals have been sequenced from five caves and rock shelters in the highlands of Pang Mapha in the northwest. They belong to a burial tradition in which the dead were placed in coffins carved from single teak trees. More than 40 such sites are known across five river valleys, and the practice is dated to between 2,300 and 1,000 years ago. Bone from the sequenced individuals dates to about 1,600 to 1,800 years ago. Their main maternal lineages were F1a1a, F1f, M7b1a1 and N8, while the paternal lineages were mostly O1b and O2a.
Their ancestry fits a mixture of three sources: about a seventh from the region's hunter-gatherers, with the remainder divided almost equally between a farming population of the Yangtze basin and one from the upper Yellow River. The authors report a good fit for this model, as well as for a simpler two-source model. The northern component is notable because it is not needed to account for the Bronze Age and Iron Age remains from Ban Chiang in the northeast. The study interprets this as evidence of two separate spheres of influence in Iron Age Thailand, consistent with differences in burial practice between the two regions.
Because so many individuals came from one archaeological complex, relationships between them could be traced. Within one cave, the study found a parent and child, a grandparent and grandchild, three uncle, aunt or half-sibling pairs, and four people whose parents were related. Long shared stretches of chromosome link that cave to a second cave in another valley, while two caves in the same valley share none. Together with the number of sites, the authors interpret this as evidence of a large and well-connected community in which kinship influenced where people were buried. Two genomes published earlier from Long Long Rak were found to belong to the same person.
Whether these people left descendants in the area remains uncertain. In one comparison, they fall among present-day Padaung Karen, Lawa and Mon. Living groups nevertheless carry ancestry that the ancient individuals lack, while a third test finds the resemblance to be general rather than specific to any particular group or language family. The authors conclude that the gene pool changed substantially after this period through later movements from Laos, Myanmar and southern China.
Genomes published earlier from Long Long Rak, one of the same group of sites, do not all fall together. That study divided its ancient individuals into five clusters, with the Long Long Rak remains split between two of them. One individual, dated to between about 1,690 and 1,540 years ago, groups with ancient individuals from northern Vietnam. In a summary of overall similarity, that cluster falls near the Dai of southern China, the Amis of Taiwan and Tai-Kadai-speaking populations of Thailand. The remaining Long Long Rak individuals, dated to between about 1,820 and 1,570 years ago, instead group with present-day Austroasiatic-speaking populations of Thailand and China.
Archaic ancestry
People living in the region carry short stretches of DNA inherited from Neanderthals and Denisovans, two extinct human groups. Across 23 populations of mainland Southeast Asia with more than twenty people sampled from each, including 31 Lawa from Thailand, each person carries an average of about 63 million letters of such sequence. The Neanderthal share is lower than in East Asian populations but higher than in South Asian ones, while the Denisovan share is close to that in East Asia. The Denisovan pattern also varies between populations: thirteen of the 23 fit a single episode of admixture, while most of the others fit two. The study interprets this as evidence of several separate episodes of contact at different times. A Neanderthal-derived segment is carried by an average of 18.6 percent of the sampled populations, compared with 3.9 percent of East Asian populations.
Natural selection
Parts of the genome that appear to have spread because they provided an advantage have been identified at two scales. Across mainland Southeast Asia, 44 regions covering 89 genes carry such a signal, 72 of them reported for the first time. The study groups their known functions into body measurements, immunity, metabolism, the nervous system, and the heart and blood vessels, and interprets the overall pattern as adaptation to a tropical environment. It also finds a signal across multiple genes associated with shorter stature. The strongest single region contains genes involved in hair form and the skin barrier, and one variant within it occurs on 17.5 percent of the chromosomes tested there, compared with less than 0.1 percent elsewhere. The authors caution that the physical effects of these genes have yet to be established.
A narrower search among the Lue of northern Thailand identified 312 positions with similar signals, 83 of them shared with Tai-Kadai-speaking populations of southern China. The overlap is greatest with the Gelao, at 40 positions, and smallest with the Dai and Dong, at nine each. The study interprets this sharing as the result of common selective pressures acting on shared ancestry, while noting that its data cover mostly non-coding regions of the genome.
Anthropometric and skeletal studies
Prehistoric human remains
A review of physical anthropology in Thailand records the earliest human remains known from the country. Skeletons from Tham Mo Khiao in Krabi date to about 25,800 years ago, while those from the Tham Lod rock shelter in Mae Hong Son date to about 13,640 and 12,100 years ago. Later remains include a burial at Tham Phra in Kanchanaburi, dated to about 10,000 years ago. Two more were found at Tham Sakai in Satun, dating to between about 9,260 and 7,620 years ago, and another at the Ban Rai rock shelter in Pang Mapha, dated to about 9,720 years ago. Only the older of the two Tham Lod skeletons could be examined in detail. The review reports that its skull cannot yet be assigned to any population, while its jaw is larger than that of present-day Thai people.
Dental disease at Non Pacha Kao
At Non Pacha Kao in Ban Krabueang, Bua Yai district of Nakhon Ratchasima, 305 sets of human remains were recovered in 2003 from a cemetery where the dead were placed in earthenware jars after an earlier burial. Radiocarbon dates from two jars, together with the decoration on their necks, place the cemetery at roughly 1,500 to 2,500 years ago. Most of the skeletons are incomplete, with only about a fifth to a third of each surviving.
Two conditions were recorded: tooth decay and teeth lost during life, leaving the socket closed by new bone. Decay was found in 29 of the 152 people whose permanent teeth could be examined, and in 32 of the 821 teeth themselves. None of the 98 milk teeth examined was affected.
Teeth lost during life were much more common. Of 147 people, 48 had lost at least one tooth, between 1 and 16 each, and 179 of 1,574 sockets had closed. The front teeth were lost more often than the back teeth, 64 of 346 compared with 115 of 1,228, with the second incisor most often affected, at 33 of 122.
Men had lost more teeth than women, 70 of 392 compared with 94 of 970. The difference is significant when counted by tooth but not when counted by person. Rates of decay did not differ between the sexes on either measure. The study interprets the pattern as cultural rather than physiological, since women carry the greater physiological risk of decay but showed no higher rate than men.
Four other prehistoric cemeteries in the northeast, dating to roughly 1,500 to 3,500 years ago, were compared with Non Pacha Kao. Decay rates do not differ across the five, ranging from 3.90 to 6.34 percent of teeth. The Non Pacha Kao population lost teeth about twice as often as those of Ban Lum Khao, Noen U-Loke and middle to late Ban Chiang, and at about the same rate as those of late Non Nok Tha. The study interprets the stable rate of decay as unlike the worldwide pattern, in which decay tends to increase as farming intensifies, and as consistent with the usual pattern reported for prehistoric mainland Southeast Asia.
The study also notes several limits to the evidence. The teeth were worn heavily to severely, which could hide decay; so many had been lost during life that few remained to examine; and the teeth were recorded by visual inspection without radiography.
Craniometric studies
Modern and archaeological crania
An early craniometric study tested two accounts of Thai origins. One holds that the ancestors of the modern Thai came from China early in the second millennium, while the other traces them to the earlier inhabitants of the country. It compared modern Thai and modern Chinese skulls with skulls from archaeological sites in Thailand and from Neolithic Chinese sites, the last taken from published reports. The Thai archaeological skulls came from Ban Na Di, Ban Kao, Tam Ong Ba, Kok Panom Di and Non Nok Tha.
On the measurements, the modern Thai sample differs from the Neolithic Chinese in more features than it does from the archaeological Thai. On the non-metric features, the pattern is reversed, with the modern Thai and modern Chinese samples coming out closely alike. The measurements also change over time, with the older skulls being larger in the face than the modern ones. Interorbital breadth separates the four samples better than any other measurement taken.
The author interprets the results as arguing against descent from populations that arrived from China, while not clearly supporting descent from the earlier inhabitants of Thailand either. The conclusion is that the two accounts are not mutually exclusive. Almost all of the ancestry of the modern Thai sample is placed with groups not included in the comparison, possibly Neolithic populations of Laos and Vietnam.
The author notes that only four populations were compared, that samples from neighbouring countries were needed, and that many measurements could not be taken from the buried skeletons.
A later comparison set a Thai sample against crania from across East and Southeast Asia. The Thai sample consisted of residents of Bangkok, measured in studies published in 1971 and 2000. It falls among present-day samples from Hainan, Celebes, Java, the southern Moluccas and Myanmar, and close to samples from southern China and the lower Yangtze. Prehistoric crania from Ban Chiang and Non Nok Tha fall in the same part of the comparison, and not with the Hoabinhian remains of Vietnam and Malaysia or with Australo-Melanesian samples. These positions are shown in a diagram, and the text does not discuss the Thai samples. The authors read the wider pattern as support for a two-layer account of the region's population history, in which early hunter-gatherers were followed by farming populations from East Asia.
Regional variation in the skull
The largest set of skull measurements for the country was taken from anatomical collections at Chiang Mai, Khon Kaen and Bangkok, from skeletons of people most of whom were born between 1926 and 1956. It was used to test whether the regions of Thailand differ in skull shape.
The three regional samples do not separate from one another, and a skull cannot be assigned to its region much better than by chance. Only one measurement in men and one in women distinguish the regions at all, and the study says it cannot explain the pattern from those two measurements alone. It therefore describes the modern Thai population as relatively uniform in skull measurements, contrary to what the archaeological and linguistic evidence might suggest.
The study attributes this to the forced movement of people in the late eighteenth and early nineteenth centuries, following the sack of Ayutthaya and during Siamese campaigns against the Lao and Khmer. It argues that these movements broke the links between regional populations and the places where they had lived, leaving too little time for a new regional pattern to develop. It reads the regional differences perceived by Thai people themselves as differences in dress, accent and manner rather than physical form.
The study notes that southern Thailand is not covered, that the Khon Kaen and Bangkok collections are small, and that its account of the modern Thai population explicitly excludes ethnic minorities such as the highland groups.
Body measurements
Body measurements have also been taken from living people, mainly for machinery design rather than the study of ancestry. Two surveys at Prince of Songkla University measured students aged 18 to 25 who came from the southern provinces. The first covered 50 men and 50 women from the seven provinces of the lower south, with numbers drawn in proportion to the adult population of each province. The second covered 100 men and 100 women from all fourteen southern provinces. Thirty-nine measurements were taken in the first survey and thirty-seven in the second, all on the right side of the body. The two surveys used different sets of measurement definitions, one from a 1991 survey of the northeast and the other from a 1988 handbook.
The southern men averaged 171.94 centimetres in height and 61.85 kilograms in weight. The corresponding figures for women were 157.94 centimetres and 49.90 kilograms. In the lower south, men averaged 169.17 centimetres and 59.65 kilograms, compared with 156.90 centimetres and 49.84 kilograms for women. Of the eighteen measurements compared between the two samples, only height differed significantly among men. There was no significant difference among women, and neither sex differed in weight. Head length differed between the female samples but not the male samples.
The southern men were taller and lighter than the 200 men sampled in central Thailand. The women, however, did not differ significantly in either height or weight from the 200 central Thai women. The central Thai men also had greater head length and head breadth than men in either southern sample. The study therefore found differences in body dimensions between the regions.
The authors note several limitations. The samples are small, students at one university are taken to represent adults across the region, and the measurements assume that clothing does not affect the results. The upper south was not surveyed at all.
Forensic applications
A DNA profile is useful for identification only when the frequency of each variant in the relevant population is known. Several of the studies above were designed to provide these frequencies for populations in Thailand. Reference sets assembled elsewhere may not work as well here, because Thai samples differ from neighbouring Asian populations both in the lineages they carry and in their frequencies.
Autosomal STR reference sets
Fifteen short repeated sequences were typed in 738 people from 22 villages in the north. Nine Tai-speaking village samples, 363 people in all, differed so little that the study pooled them into a single reference set. Within this set, the chance of two unrelated people sharing a profile is about one in seven billion billion. For the Lua village with the least variation in the sample, the chance is about a thousand times higher. One of the fifteen positions departed from the expected genotype distribution and carried two rare variants. At two of the nine positions shared with a published northern Thai reference, the values differ significantly between the two sets.
A reference set covering all nine officially recognised highland groups and four others without that status draws on 983 people from 27 populations. The fifteen positions distinguish one hill-tribe sample from another with a probability of 99.999999 percent. The nine recognised groups carry 177 variants when pooled, and all thirteen groups together carry 191. Seven of the fifteen positions departed from the expected genotype distribution.
Another reference set uses fifteen positions from a different commercial kit and covers 500 people from eleven Tai-Kadai populations in three regions. Across the eighteen populations compared, the chance of two unrelated people sharing a profile varies by about a factor of one hundred. The power to exclude a wrongly accused relative is above 99.99 percent everywhere except among the Saek and one Lue village, the two populations with the least variation in the set.
The same set was later expanded to 26 populations and 1,153 people, adding the first published allele frequencies for populations sampled in Laos using the same panel. A single-village set using the same fifteen positions, based on 53 people from Buriram, gives a combined power to exclude a wrongly accused relative of 99.90 percent.
A further set using the same fifteen positions covers 246 central Thai and 139 Mon. The power to exclude a wrongly accused relative is above 99.9999 percent in both groups and is slightly higher among the central Thai. A single-population set using the same fifteen positions covers 43 Yuan from Saraburi. The position with the least variation in this set is the same one reported as least variable in other Thai samples.
A regional set of fifteen repeated sequences covers 334 people from nine southern populations, including 184 newly typed people and the Maniq and three sea nomad groups. The power to exclude a wrongly accused relative across the fifteen positions is 99.999622 percent. Two positions departed from the expected genotype distribution, and the authors say this needs to be taken into account in casework even though both positions have good power to distinguish individuals.
A set of 23 autosomal positions, eight reported for these populations for the first time, has been typed in 451 people from seven Lao Isan and three Laotian populations. The chance of two unrelated people sharing a profile is several orders of magnitude lower than with the fifteen positions used in the earlier study of the same populations. Two of the 23 positions departed from the expected genotype distribution in one population each, while two others did so in the pooled sample of 412 ethnic Lao.
Y-chromosome reference sets
A Y-chromosome reference set based on seventeen repeated sequences covers 85 men from five southern populations and 445 men from eleven populations across the country. In the national set, 379 of the 409 profiles occur only once. The authors caution that the Moklen face a higher risk of a false match when their profiles are compared with the pooled national set rather than a reference set of their own. They also have the lowest power to distinguish individuals among the populations compared.
A survey of two border provinces added 24 repeated sequences on the Y chromosome and found 289 distinct profiles, 23 of them shared by more than one man. At one of the 24 positions, variation is much narrower among the men sampled in Tak than among those in Ranong or in the pooled Thai sample.
Mitochondrial reference sets
The maternal line has also been used for the same purpose. A variable stretch of mitochondrial DNA, 1,122 letters long, was sequenced in 190 men from rural villages across Chiang Mai province, giving 145 distinct sequences. The chance that two unrelated people in the set carry the same sequence is about one in a hundred. About a seventh of its sequences also occur in samples from Japan, northern China, Korea, Taiwan, Vietnam and Malaysia. The set nevertheless differs significantly from those populations in both the lineages present and their distribution, which the authors give as a reason for using regional databases. The sequences were deposited in EMPOP, a reference database of maternal lineages used for identification.
Ancestry-informative marker panels
A third approach uses single-letter differences rather than repeated sequences. One study worked from genome-wide data for 374 Thai participants and eleven reference populations. It assembled three panels of markers selected for the differences in their frequencies between groups: 124 that distinguish continents, 89 that distinguish the Thai sample from other Asian populations, and 273 that distinguish northern from southern Thai samples. Eleven markers in the first panel differed completely between the groups compared. The authors propose using the panels to establish regional origin when a person's own account is unavailable or unreliable, including in the identification of unidentified bodies.
Identification of undocumented residents
The survey of the two border provinces also points to a direct application. Thailand has more than half a million residents without recognised citizenship. The authors propose using profiles from documented citizens as a reference when a person without documents needs to support a claim of kinship with an established local population. They stress that such evidence should be used alongside other forms of evidence rather than on its own, and cite published objections to using DNA as a proxy for nationality.
Medical genetics
Blood group antigens
Red cell antigens are typed to help select compatible blood for patients who receive repeated transfusions, and the recorded frequencies are used for the same purpose. Two hundred donors at an army blood bank in Bangkok, 147 men and 53 women aged 17 to 58, were typed for nine systems.
Group O was the most common at 40.5 percent, followed by B at 30.5, A at 20.5 and AB at 8.5. All 200 donors were RhD positive, with CCDee the most common Rh type at 51.5 percent. In the MNSs system, M was common while N and S were uncommon, with MMss at 43.5 percent and MNss at 32 percent. Fya was present in all but three donors.
Le(a-b-) occurred in 23.5 percent, while 30 percent reacted with anti-P1. Among the Kell types, only kk and Kpb-positive were found, and the Lutheran system was limited to Lu(a-b+). Jk(a-b-), described by the authors as rare among Thai people, was not found. They considered the overall pattern typical of Southeast Asia.
Disease-risk variants
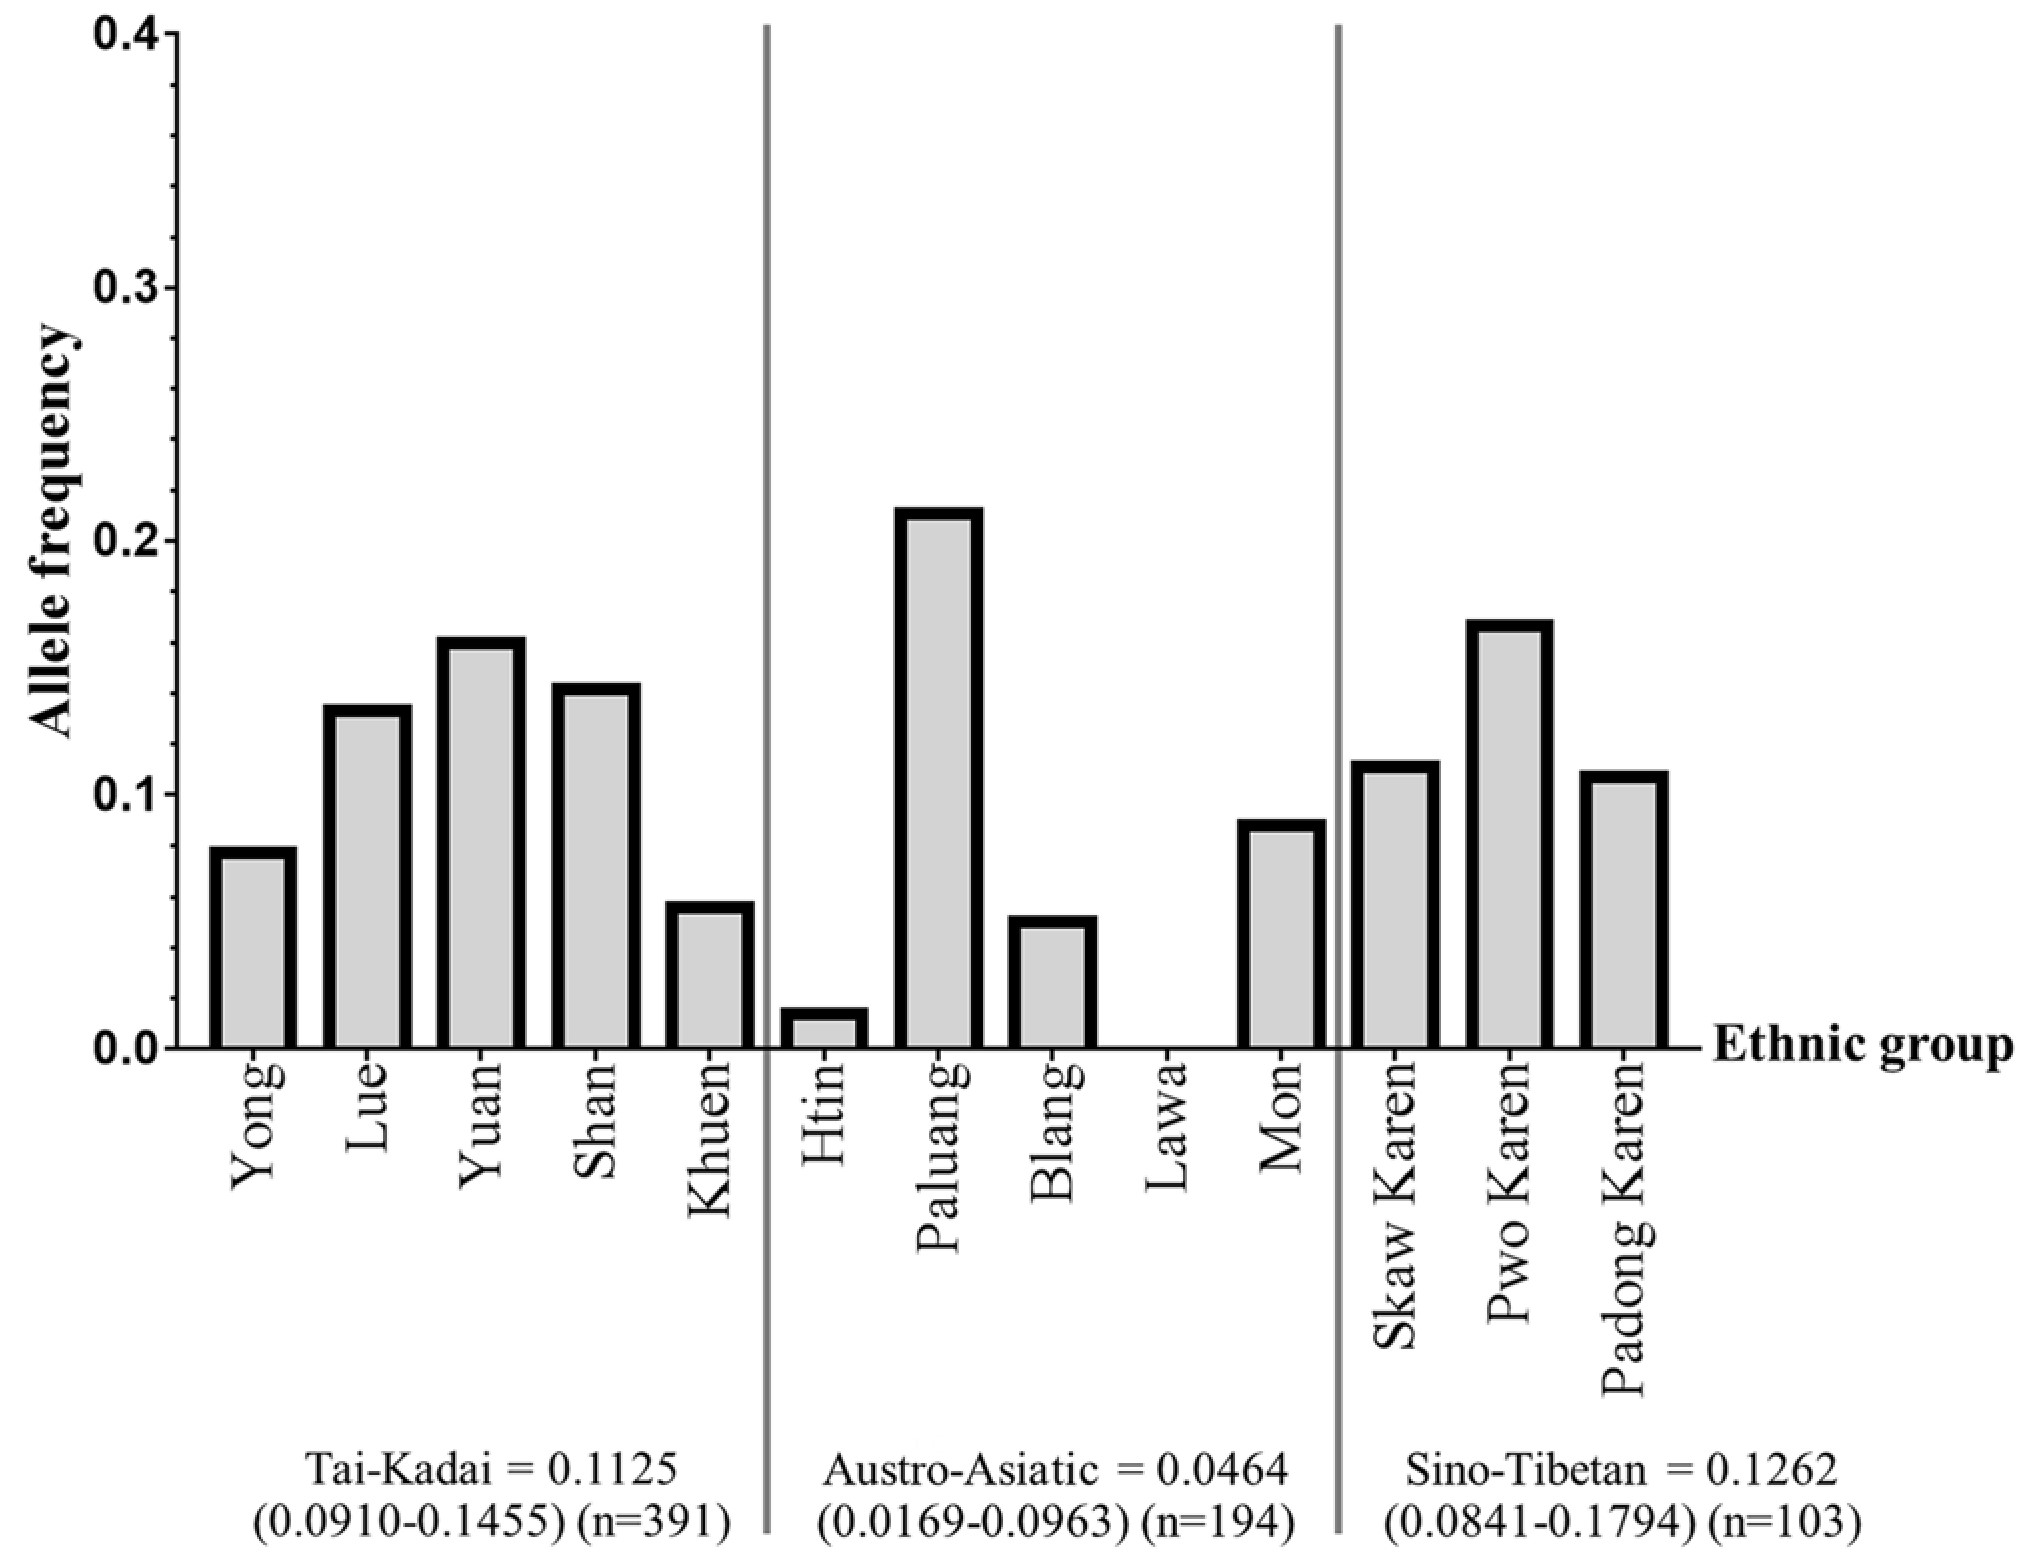
A survey of 3,023 whole genomes from 30 populations in mainland Southeast Asia, including four in Thailand, found 604 variants listed as disease-causing in a clinical reference database. Each person carried between 2 and 11 of these variants. Ten of the 604 are common in the region but rare elsewhere, leading the authors to suggest that most were probably misclassified. One was treated separately: a variant of the HBA2 gene associated with alpha thalassaemia. It occurs at 5.3 percent across the region but at under 0.01 percent in other world populations. The authors regard this as a genuine risk variant, with its frequency maintained by the prevalence of malaria in the region.
Alpha thalassaemia has also been surveyed in thirteen ethnic groups in the north, covering 688 people from thirty villages in five provinces. About one person in five carried one of the six forms tested, with a deletion of a single alpha-globin gene by far the most common. Two forms reported elsewhere in Thailand, the Thai-type deletion and the Hb Pakse variant, were not found in this sample.
The frequencies differed sharply between groups. Alleles that remove one gene occurred at about 13 percent among the sampled Sino-Tibetan speakers and about 4 percent among the sampled Austroasiatic speakers. The Palaung had the highest frequency, at about 21 percent, while none was found among the 48 Lawa tested. Alleles that remove two genes, which carry a greater clinical risk, showed the opposite pattern: about 3 percent among the sampled Tai-Kadai speakers, under 1 percent among the Austroasiatic speakers and none among the Sino-Tibetan speakers. The authors suggest that the high frequencies of single-gene deletions among the Palaung, the Karen and the Shan may reflect selection for resistance to severe malaria. All three groups live along the Myanmar border.
Regional HLA variation

The HLA genes, a set of immune-system genes that vary more between people than any others known, also show regional differences. Among 470 people recruited through a national health survey and grouped by the region they said they came from, measures of overall similarity separated the northeastern and southern samples from each other. The northern, central and Bangkok samples fell between them, with the central and Bangkok samples the most alike of the five. The most common variant at one of these genes showed the same division. HLA-DRB1*15:02 was most common in the northern, northeastern and southern samples of 100 people each, while HLA-DRB1*12:02 was most common in the central sample of 100 and the Bangkok sample of 70.
In the southern sample, HLA-B*15:02 was the most common variant at the HLA-B gene, occurring on 9.0 percent of the chromosomes tested in 100 people. B*46:01 was the most common in the other four regional samples. Two other variants of the same family, B*15:11 and B*15:21, were also found in the southern sample, at 0.5 percent each.
Of the drug-risk variants compared across the five regional samples, only one differed significantly between regions. HLA-DRB1*16:02 occurred on 10.0 percent of the chromosomes tested in the northern sample of 100, compared with 1.4 percent in the Bangkok sample of 70.
Drug-response markers
Some HLA variants are linked to serious reactions to particular drugs. HLA-B15:02 is one such variant, and is associated with severe skin reactions to Carbamazepine and related antiepileptic drugs. A test for this variant alone does not cover the related variants found alongside it in the south. The relevant variant also differs between countries. Among the 470 people in the health survey, HLA-B*15:02, the marker used before Carbamazepine in Southeast Asia, occurred on 7.7 percent of the chromosomes tested. It reached at most 0.2 percent in four United States reference samples of 187 to 265 people, and 4.9 percent in an Asian American sample of 358. HLA-A*31:01, used for the same drug in Europe and Japan, showed the opposite pattern: 0.85 percent in the 470, compared with 7.8 percent in the North American reference sample of 187. HLA-B*58:01, tested before Allopurinol is prescribed, occurred at 6.4 percent. This was close to the African American sample of 252 and the Asian American sample of 358, and higher than in the three other reference samples. Three variants tested elsewhere were not found in the survey sample: HLA-B*38:01, B*59:01 and A*30:02.
Beta-lactam antibiotics, including the Penicillins, are the most commonly reported cause of antibiotic hypersensitivity in Thailand. The genetic markers involved are less firmly established than those for reactions to antiepileptic drugs. Thirty-seven adults with a confirmed reaction, recruited at three hospitals, were sequenced and typed at seven HLA genes. Two variants of one gene stood out: HLA-DQA1*01:04 and HLA-DQA1*05:05. The authors treated both as candidate signals rather than established markers. Neither remained significant after rarer variants were excluded, and the study did not support screening patients for them. The comparison figures came from earlier Thai datasets rather than from a control group recruited alongside the patients, including the national health survey sample of 470. Neither variant matches the one reported for penicillin allergy in Europe, and the two variants reported in Thai children were absent from this adult sample. Among the six patients with severe skin reactions, three carried HLA-A*33:03 and two carried HLA-B*15:02.
Interpretation and debate
The authors of several studies also point out limitations in these results. An ancestry component labelled with the name of a people does not necessarily represent descent from that population, as one study notes explicitly about its own results. The South Asian shares reported among Austroasiatic speakers are minimum estimates, since the population used as the local reference already has some South Asian ancestry.
Sources of Lao Isan ancestry
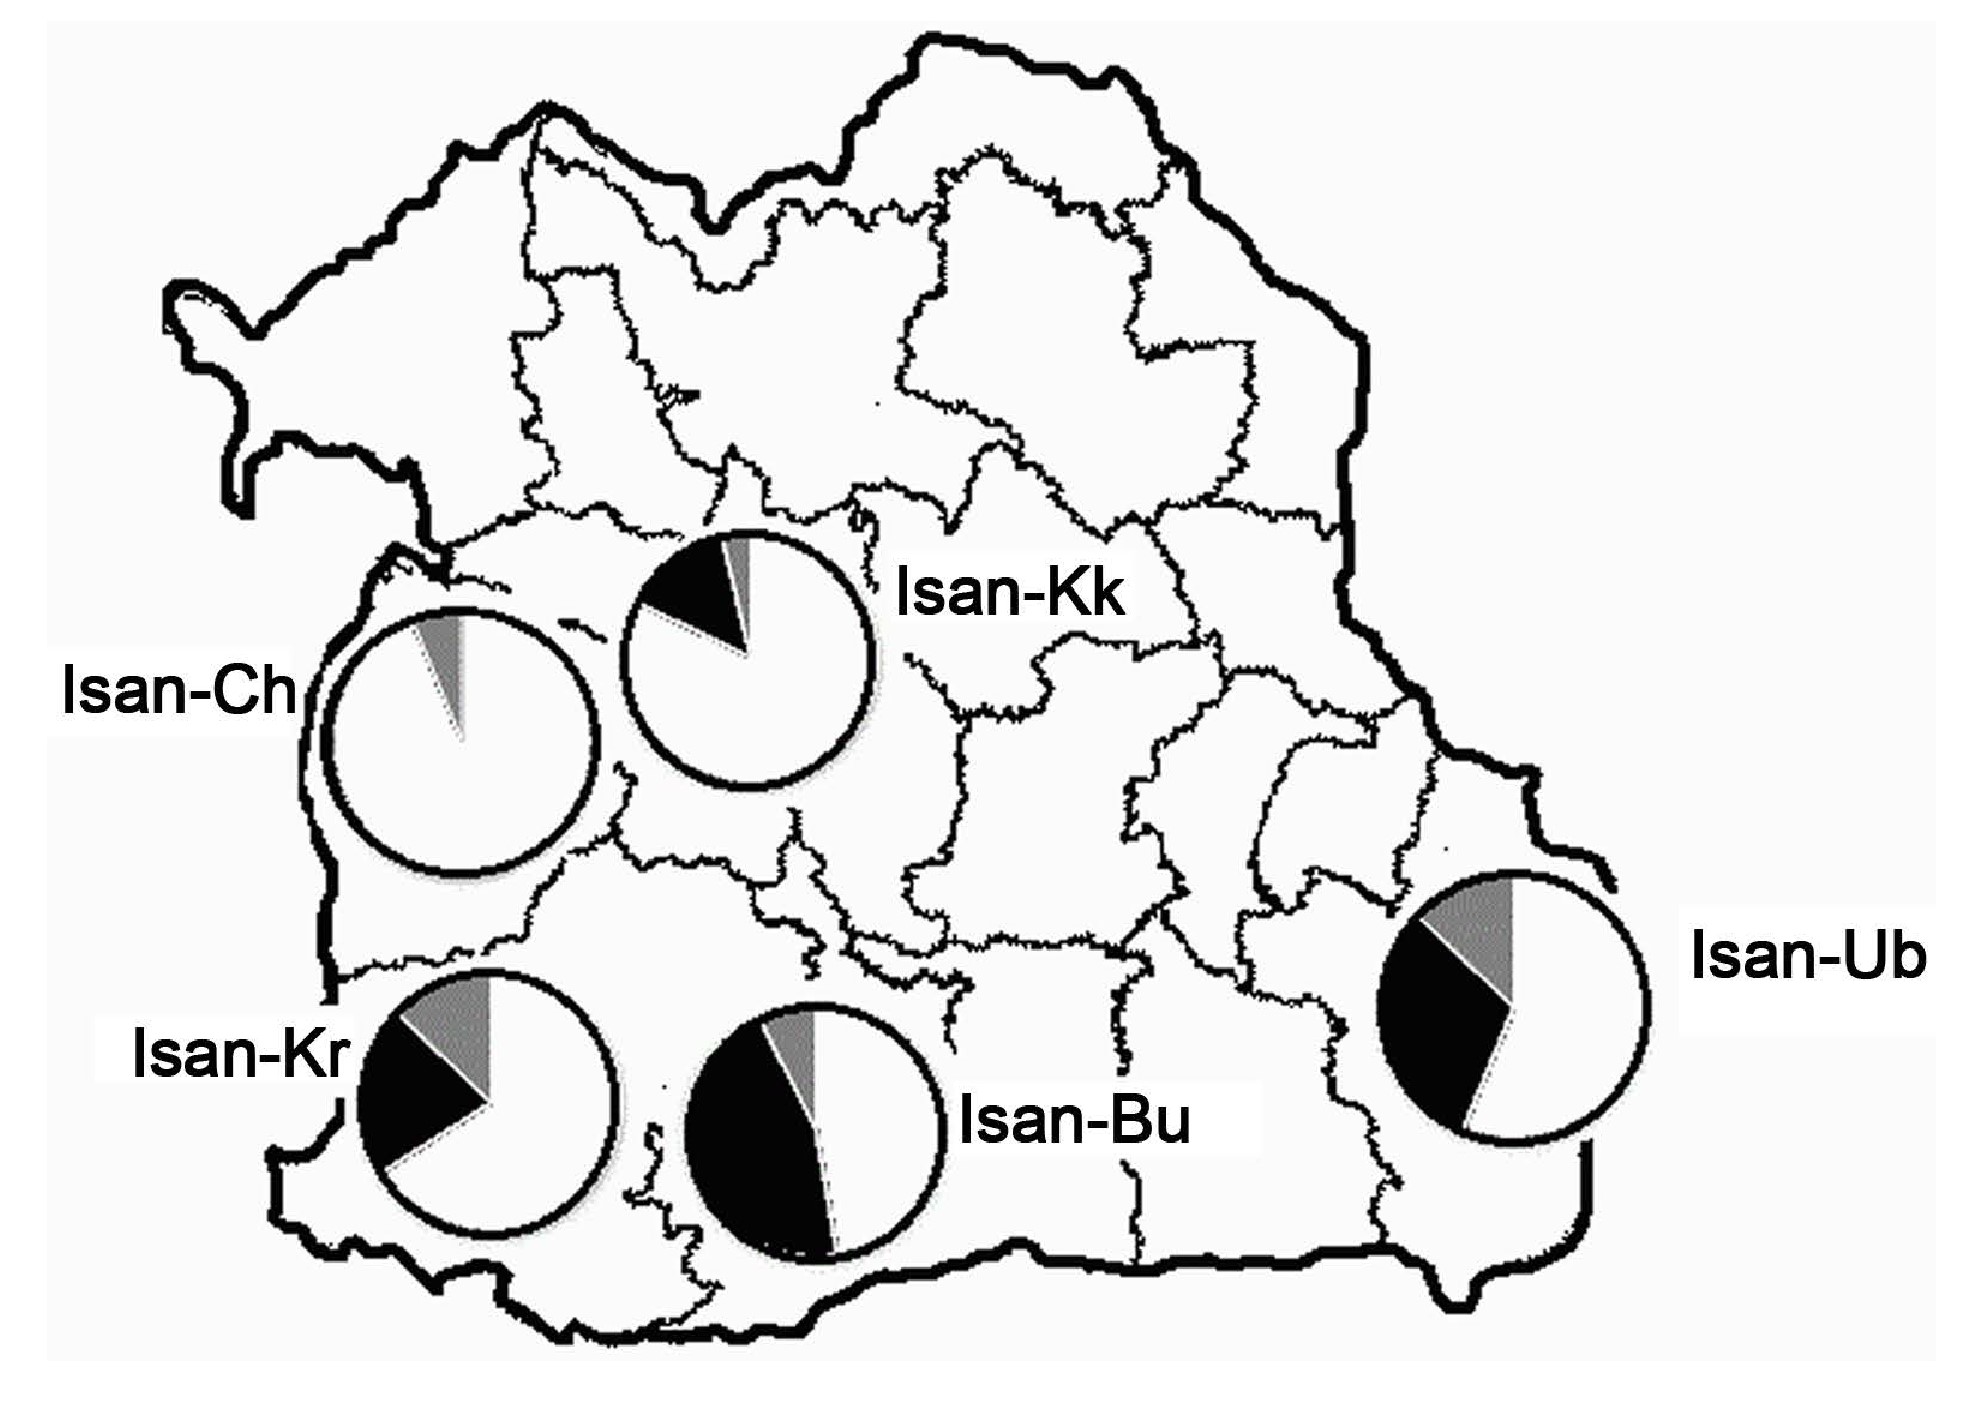
Two studies of the Lao Isan in Buriram use different markers and different sets of possible sources, and do not give the same result. Kutanan and colleagues used maternal lineages and included the Lao of Laos, three Khmer samples and the Nyah Kur as possible sources. In every Lao Isan population they tested, the Lao source contributed more than the other sources, between 47 and 94 percent. Buriram was the exception, with the Khmer share the largest.
Srithongdaeng and colleagues used fifteen repeated sequences. They had no Lao data, so they modelled the Buriram population using neighbouring populations instead. They attribute the different results to the mode of inheritance and to the different sets of possible sources used in the two studies. The maternal study also notes that its Lao reference sample was collected from across Laos without recording the language of each donor. The Lao component may therefore include people who speak other language families.
A third study looked at a Lao Isan population in Roi Et rather than Buriram. Its model includes about 31 percent Northern Khmer ancestry, together with a much smaller Kuy component. The authors relate these figures to the Khmer monuments of the lower northeast and the later arrival of Lao populations from Laos.
Maternal ancestry in the north
Whether the maternal lines of the Khon Mueang trace back to the Austroasiatic-speaking populations who lived in the north before them has produced different results. Using a short stretch of mitochondrial DNA, Brunelli and colleagues found that the result depended on whether the analysis assumed a branching history or one involving mixing. They considered the maternal side more likely to show mixing with Austroasiatic-speaking neighbours. Using complete mitochondrial genomes, Kutanan and colleagues found stronger support for an arrival from southern China. They also state that the Lawa, with whom the Khon Mueang have documented contact, were not their maternal ancestors.
The question had already been raised in an earlier survey, although that study could not resolve it. It found no clear relationship between the Khon Mueang and the Austroasiatic-speaking groups of the north, and noted that genetic data for the Lawa and Mon were not then available for comparison.
Marriage residence
Where a couple settles after marriage has been used to explain differences in maternal variation between villages, but studies of the Lawa have drawn different conclusions. Kampuansai and colleagues describe Lawa women as moving to their husbands' villages and link this custom to the wide range of maternal sequences found within each village. Kutanan and colleagues give the opposite custom as an example of what reduces variation in hill groups, and include the Lawa among those groups.
Two earlier surveys address the mechanism rather than the Lawa. Both found less maternal variation among the Htin, described as a group in which the man moves to his wife's village, than among Austroasiatic populations in which the woman moves. The later study uses some of the earlier data and follows the same interpretation, while adding the lua to the pattern. A study of Chiang Mai recalculated published data from six northern groups and found the least maternal variation among the Red Karen, described as a group in which the man moves to his wife's village.
The survey covering 73 populations gives a different emphasis. Its authors identify isolation, together with the custom of a husband moving to his wife's village, as the main influences on the hill populations. For lowland groups, including the Mon and Tai-Kadai speakers, they consider mixing with neighbouring populations more important.
The first comparison using the same type of sequence data for both maternal and paternal lines covered five highland groups. The groups were divided by marriage residence: the wife moves in the Khmu, Lawa and Palaung, while the husband moves in the Htin and Karen. The differences in both lines generally followed the expected direction, but most were not statistically significant. Only the greater range of paternal lineages in the groups where the husband moves was significant. Among three Lawa populations, differences between populations accounted for 34.4 percent of paternal variation and 7.8 percent of maternal variation. Among three Htin populations, the figures were 11.5 and 25.7 percent, respectively. The authors take the weak statistical support as evidence that other factors also affect the pattern. They point in particular to isolation in the mountains, which can reduce variation within villages while increasing differences between them.
The Kuy of Surin provide another case. A study describes the Kuy as one of the few communities in Thailand and Laos in which the husband moves to his wife's village. The authors give this custom as one possible explanation for the absence of detectable mixing between the Kuy and either neighbouring population. They also suggest that a community that retained its own language while neighbouring groups adopted other languages may have had less marriage with outsiders. They note that paternal-line data would be needed to test the first explanation.
South Asian-related ancestry


Recent studies all report some ancestry related to South Asia, but they do not agree on when it entered the populations studied. Depending on the study and method, estimates range from about 500 to 1,200 years ago, while one study gives three different ranges. Most studies find the signal in central and southern groups and the Mon. One analysis instead finds an Indian-related component in northern populations.
The same dataset has also produced different results about how widely the ancestry is found. Kutanan and colleagues reported South Asian ancestry in seven populations, including the central and southern Thai. Changmai and colleagues later re-examined the genomes using three methods based on different types of information. They confirmed the signal in the central and southern Thai and found it in three additional populations: the Khon Mueang of the north, the Lao Isan of the northeast and the Austroasiatic-speaking Palaung. They date the three additional signals to between about 360 and 720 years ago, compared with roughly 800 years for the central and southern Thai in both studies. Yin and colleagues instead argue that related ancestry was already present in remains from the farming period, about two thousand years earlier. They caution that this may be an overestimate and could reflect a lineage shared much further back among populations in South, Southeast and East Asia.
A study that specifically searched for the signal genotyped ten groups in Thailand, with nine or ten people in each, as well as 31 Akha. South Asian-related ancestry was found in four groups and not in the others. The estimated proportions were about 4.6 percent in a Northern Khmer-speaking sample, 4.3 percent among the sampled Kuy, 11.6 percent among the sampled Mon and 7 percent among the sampled Nyah Kur, with uncertainty of about one to two percentage points in each case. No such ancestry was found in the sampled Akha, Lawa, S'gaw Karen, Hmong, Htin, Maniq or Mlabri. The authors interpret this division as evidence of contact rather than descent. The first four groups inherited language and culture from states influenced by India, while the other seven remained outside that influence until more recently.
The dates estimated from shared stretches of chromosome place the admixture between about 500 and 1,000 years ago for most of the populations tested. The Northern Khmer-speaking sample is earlier, at 1,218 to 1,291 years ago, while the Mon is more recent, at about 600 years ago. Eight of more than fifty South Asian populations tested contributed at least one percent to the ancestry of one or more target groups. The Bengali was the largest contributor in every case. The authors caution that Bengali is the only comparison population in this set with detectable East Asian ancestry, which could make its apparent contribution look larger than it really is. They interpret the different source populations and dates as evidence for several movements rather than a single event.
The maternal and paternal lines give different results in these populations. On the maternal side, most Austroasiatic- and Austronesian-speaking groups in the region are closer to South Asian populations than the Tai-Kadai groups are. On the paternal side, the pattern is reversed. Using a model with two source populations and admixture placed at about 2,000 years ago, the sampled Tai-Kadai-speaking southern Thai have about 15 to 30 percent South Asian ancestry on the maternal side. On the paternal side, the estimate is about 54 percent. A western Mon sample has no South Asian ancestry on the maternal side and about 39 percent on the paternal side. Two Austronesian-speaking groups in Vietnam show the opposite pattern, with about half on the maternal side and less than a tenth on the paternal side. The authors relate these differences to marriage practices and to contact with neighbouring populations.
Nayu, southern Thai and Mon
The origin of the Malay-speaking Nayu of the far south remains disputed. The disagreement is mainly over how the genetic data should be modelled. Kutanan and colleagues found the Nayu genetically continuous with local Austroasiatic-speaking groups and distinct from Austronesian speakers in Taiwan and Island Southeast Asia. They interpreted this as evidence that the Nayu adopted their language rather than brought it with them. Changmai and colleagues, using the same genomes, reached the opposite conclusion. The Nayu share more of their genome with Austronesian speakers of Island Southeast Asia than any other population in Thailand does. They interpret this as evidence of migration from the islands followed by mixing with local populations.
The difference comes partly from the modelling method, which represents population splits and mixtures as branching diagrams. Changmai and colleagues refitted the two diagrams used in the earlier study and found hundreds of other models that also fit the data. About a hundred fitted the more complex model significantly better. They do not present their alternatives as definitive, and say that every model of this kind is likely to be wrong in some respect. A later study of complete maternal genomes, using samples from the first study, presents both interpretations without choosing between them. Its authors favour language spread mainly through adoption, but note that the maternal lineages also point to some connection with Austronesian speakers of island Southeast Asia. Migration followed by mixing with local populations would also fit the data, they say. The sampled Nayu are, however, closer to mainland populations than to the Amis and Atayal of Taiwan.
Another result from the earlier study has been challenged using the same data. Kutanan and colleagues proposed genetic continuity or mixing between the central Thai and the Mon. Changmai and colleagues instead found the Mon closer to most other populations in Thailand than to the central Thai, with the central Thai showing the reverse pattern. They caution that the complicated histories of both groups may affect the statistic used in the analysis, and that their result does not exclude a relationship between them.
A third study approaches the question using different markers. Fifteen repeated sequences typed in 246 central Thai and 139 Mon place the two groups close together. The sampled central Thai were also closer to the Mon than to any other population in the comparison. The authors suggest that the central Thai may be descended from the Mon. The central Thai and Mon DNA used in this study came from the same collections that supplied the genomes examined in the two studies above.
Austroasiatic branches
The genetic relationship between the Khmuic and Katuic branches of Austroasiatic is not consistent across the populations studied. Kutanan and colleagues reported shared ancestry between the two branches, while Kampuansai and colleagues found that the Mlabri and one Htin population share ancestry with Katuic speakers but that the Lua share almost entirely within their own branch. Palaungic-speaking populations of the northwest show links to both branches, with the Khmu, Mlabri and Lua on one side and the Katuic-speaking Kuy, Bru and So on the other.
Another study, covering six branches, found differences within the branches as well. Its Katuic-speaking Kuy sample carries ancestry related to South Asia, unlike the Katuic-speaking Bru and So in the earlier study. The sampled Kuy are genetically closer to the Northern Khmer and the Nyah Kur, which belong to two other branches, than to Khmuic speakers. The authors report variation both within and between branches and attribute it to different histories of contact with neighbouring populations.
An earlier survey of maternal lineages from 36 northern populations produced a grouping that cuts across the linguistic branches. It placed the Khmu, one Htin sample, the Mlabri, the Palaung and the Mon in one cluster, with the other eight Austroasiatic populations in the other. Both Palaungic and Khmuic speakers occur in the two clusters, while the Htin sample in the first cluster is the Mal. The authors concluded that language has little effect on maternal relationships within the Austroasiatic family.
A study using different markers gives a different result for another pair of groups. Fifteen repeated sequences typed in 31 Northern Khmer and 47 Kuy from Surin place the two close to each other and separate from all ten other populations in the comparison. The authors regard this as consistent with a classification that places the two languages in the same major branch of the family. The Northern Khmer sample also has the widest range of variation among the twelve populations compared.
Log coffin origins
How the log coffin tradition reached northwestern Thailand is disputed. An earlier study of maternal lineages placed its origin in Yunnan and treated it as a practice adopted without any movement of people. It found the present-day Khon Mueang and Yuan the closest living match to the buried population. Carlhoff and colleagues, working from whole genomes, instead find a genetic contribution from outside the region arriving before or with the coffins, with no clear link to any particular living group. A third reading comes from the genomes published earlier from Long Long Rak, which the study takes as supporting an origin for the site in southern China.
Population expansions
Maternal estimates
Two periods of growth have been identified from complete mitochondrial genomes of people in Thailand. The first, of more than twentyfold, falls about 26,000 to 22,000 years ago; the second, of about fourfold, about 3,800 to 2,500 years ago. An earlier study using the same kind of data placed a single expansion about 55,000 years ago. The later authors attribute the difference to the mutation rate assumed rather than to the data. Rerunning their own analysis at the rates used by the earlier study moves their first expansion to about 53,000 years ago.
An earlier survey of ten northern Tai-speaking villages put a single expansion at 66,000 to 74,000 years ago. That estimate rests on a short stretch of the same molecule and on a stated rate of 33 percent divergence per million years.
A larger survey of 1,234 genomes from 51 populations finds growth in most of them around 50,000 to 40,000 years ago, followed by stability and then a fall around 2,000 years ago. Eight Austroasiatic-speaking samples show the fall without the earlier growth. The study uses separate rates of change for two parts of the molecule, whereas the later study uses a single rate throughout. Its authors caution that the way samples are collected can itself produce the appearance of a fall.
A later extension of that survey finds five different patterns among 22 populations. The most common is growth between about 60,000 and 50,000 years ago followed by a fall in the last 5,000 years. One Karen, one Mon and one Lue population instead remain stable before falling sharply in the last 1,000 to 2,000 years.
Across nineteen Tai-speaking populations in five countries, maternal population size remains flat until about 5,000 years ago and then rises steeply to the present. The authors connect the rise to the arrival of rice farming, which reached the areas those populations now occupy within the same period.
Estimates of past population size from the maternal line separate the two kinds of population in the south. The three major southern Thai groups remain steady over a long period, while the Chao Lay and the Maniq show a decline around 3,000 to 2,000 years ago. Austronesian-speaking populations elsewhere in mainland Southeast Asia show a similar decline at about the same time. The study cautions that a decline of this kind can be produced by the method rather than by a real fall in population size.
A nine-letter deletion in the mitochondrial molecule, common across Asia, has been dated twice in Thai sequences within one study, giving two different ages. The lineages carrying it fall into two clusters, coalescing about 49,200 and 22,500 years ago under an assumed substitution rate. Read this way, the deletion arose twice; using the distances between the clusters instead suggests a single origin. The study reports that it cannot distinguish between the two possibilities.
Paternal estimates
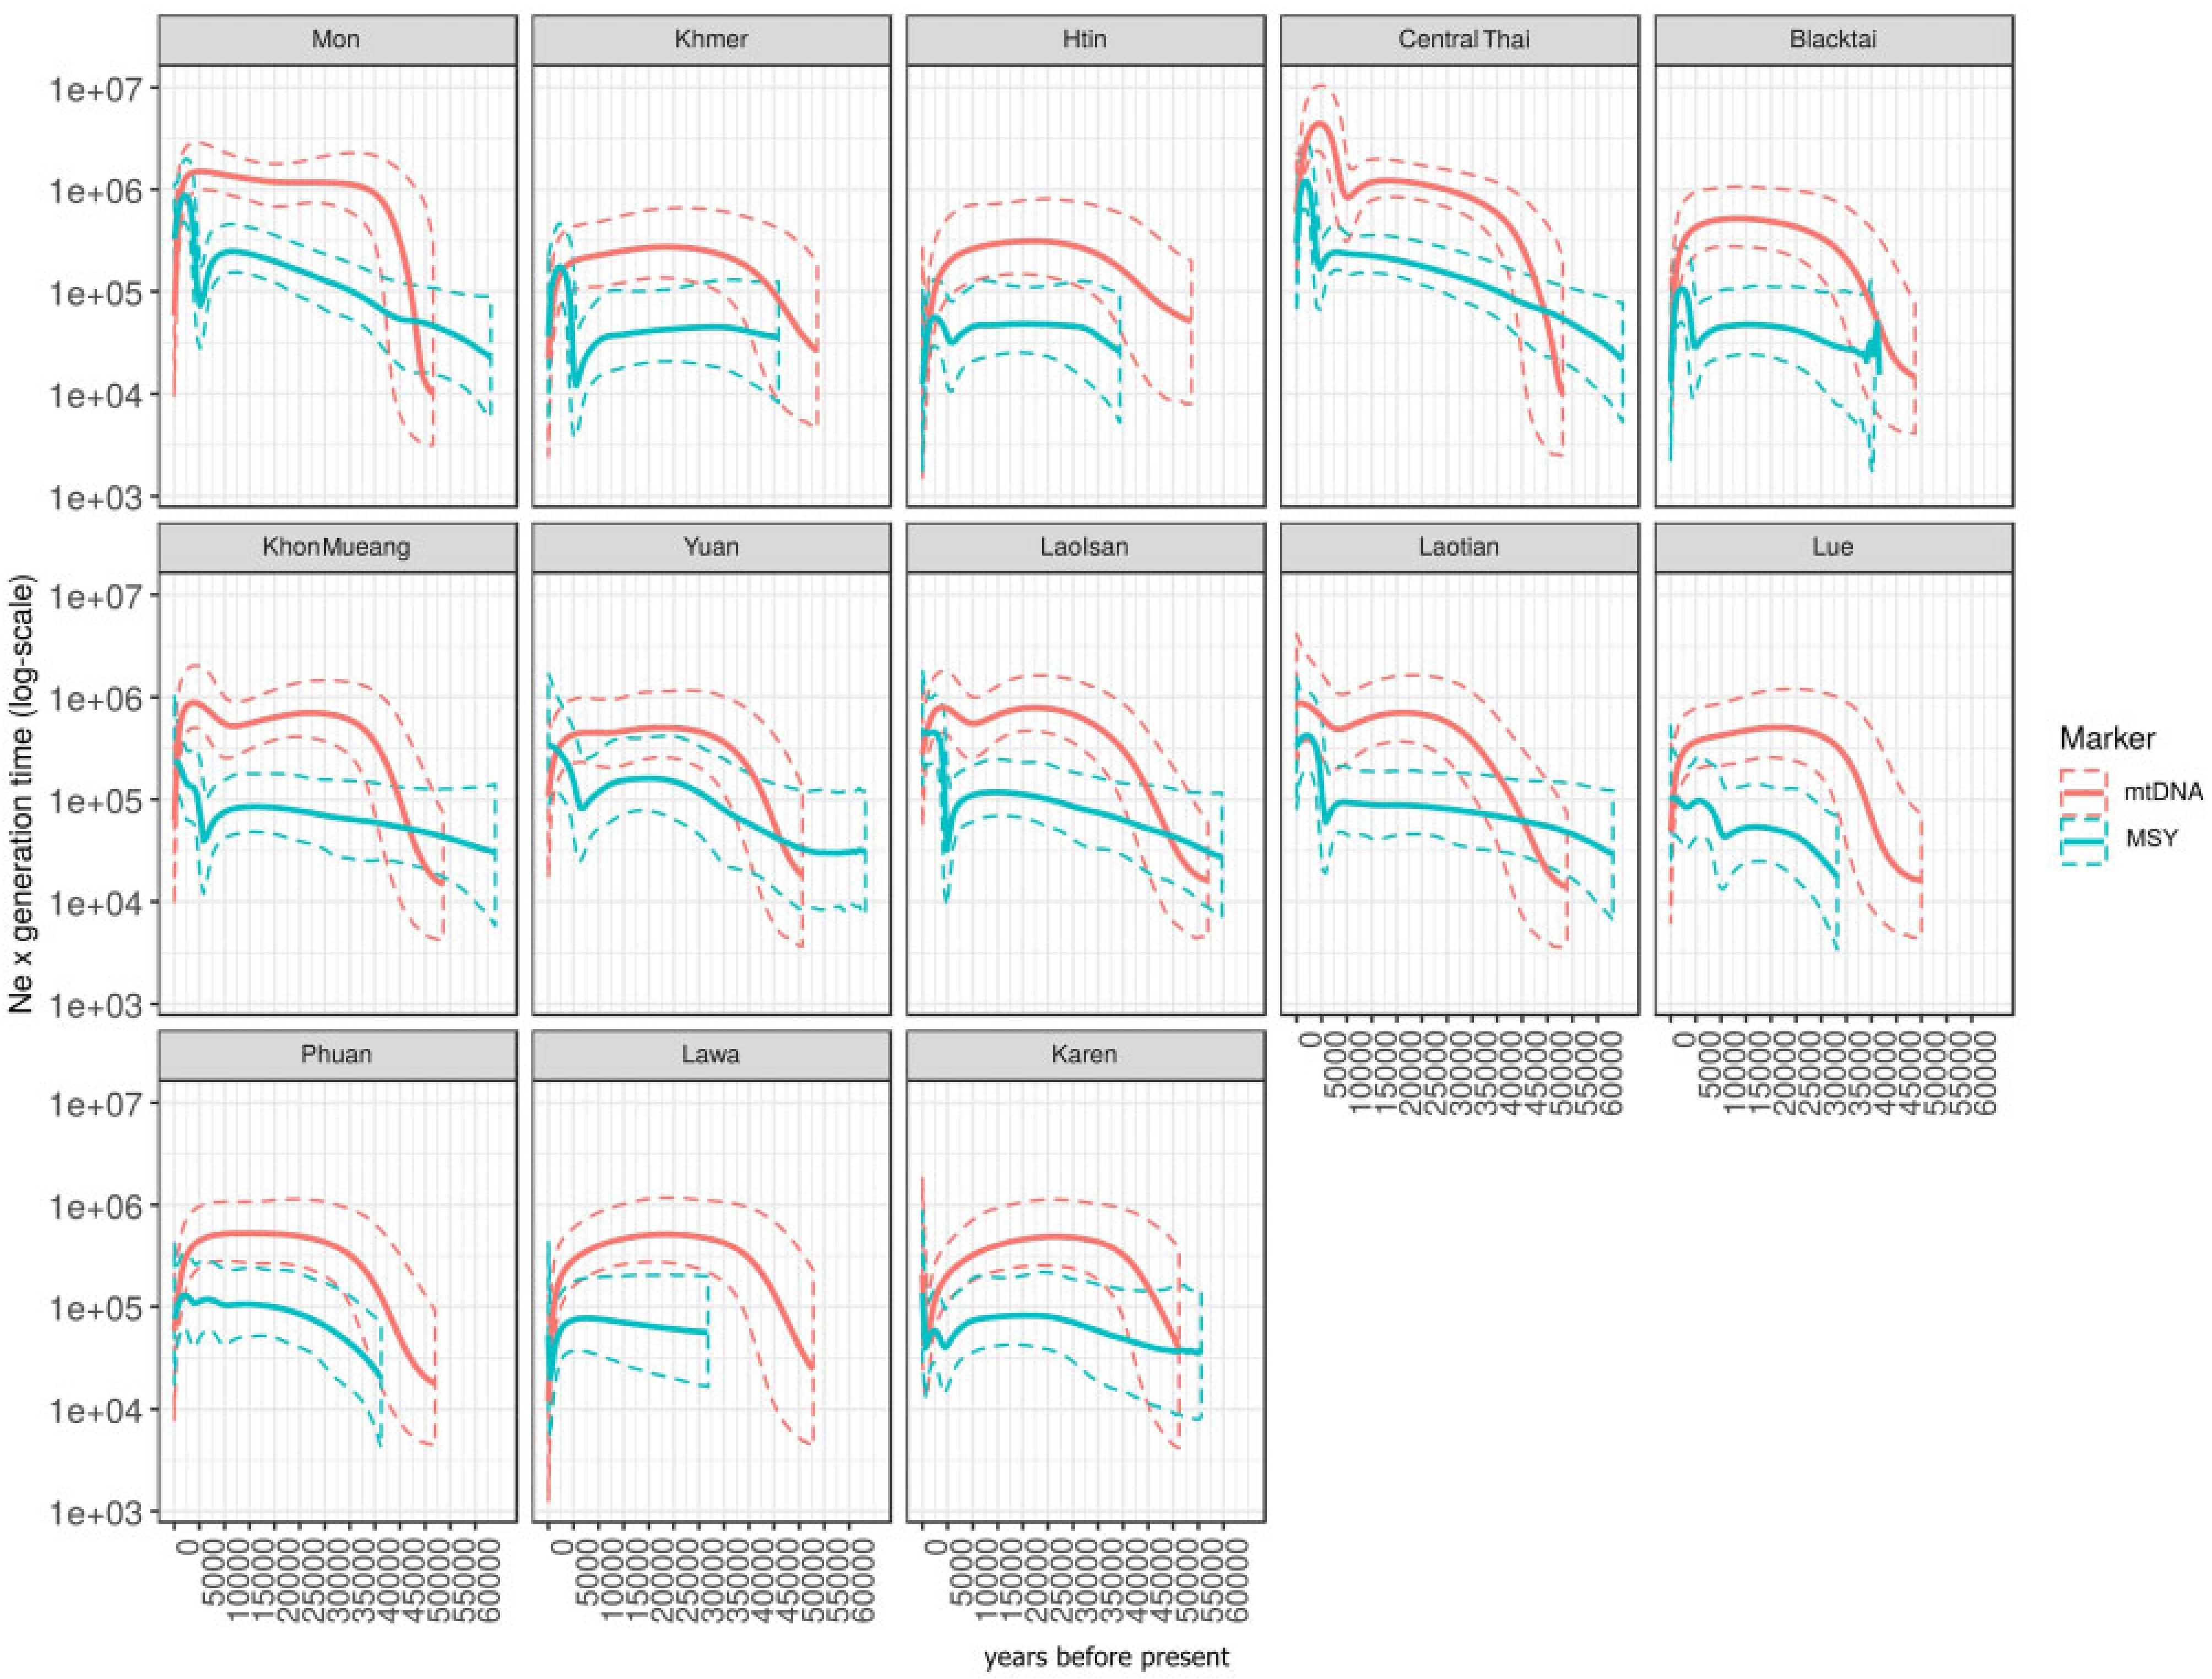
Male lineages show a different sequence of events. Y-chromosome sequences from 928 men indicate four periods of growth: about 11,000 to 9,000 years ago, about 5,000 years ago, about 2,500 to 2,000 years ago and about 1,000 years ago. Only the first has a counterpart on the maternal line, where growth is also seen around the beginning of the Holocene. The study associates the second period with the spread of farming, mainly through lineages common among Austroasiatic-speaking groups, and the third with lineages common among Tai-Kadai-speaking groups. Estimated ancestral population sizes are lower throughout on the paternal line than on the maternal line.
The two sexes have also been examined separately in the south. Maternal population size in both sampled southern Thai groups rose between about 45,000 and 30,000 years ago and remained steady afterwards, while paternal population size in the Tai-Kadai-speaking sample rose until about 7,500 years ago and then remained stable. The study notes that this paternal line shows none of the decline between about 5,000 and 2,500 years ago reported for other Tai-Kadai groups.
Whole-genome estimates
Whole genomes give a longer view of the same question. Across 30 populations in mainland Southeast Asia, including four in Thailand, the study traces their shared history back more than 150,000 to 200,000 years. This is followed by a long period of small population size, from about 100,000 to 10,000 years ago, which the study attributes to the last glacial period. Rapid growth appears in the past 10,000 years, which the study connects to the spread of farming.
Language and geography
Studies comparing language and geography do not give the same result. Which of the two is more closely related to genetic similarity varies between populations and datasets.
Results favouring language
Across eighteen northern populations, genetically related populations were also linguistically related, while geographic proximity showed no such pattern, using a measure of linguistic closeness developed by the authors.
The largest test of the question so far reaches the same result for Tai-Kadai speakers. Across eighteen populations, genetic distance closely follows linguistic distance but not geographic distance, and a simulation comparing the two explanations favours language. The authors qualify this result: the linguistic distances are based on their own classification because the subgrouping of the Southwestern Tai languages is disputed, and they expect the correlation to become stronger once it is resolved.
Across 73 populations in Thailand and Laos, analysed using complete maternal genomes, grouping by language family accounted for 0.9 percent of the variation, compared with 0.2 percent for grouping by region; the latter was not statistically significant. A survey of maternal lineages reaches the same result using a different type of data and likewise finds language family the better of the two indicators. Its authors add that both may be weak indicators, since variation within populations is high while variation between them is low.
Across 32 Asian populations compared on the paternal line, grouping by language family accounts for 8.4 percent of the variation and grouping by broad region for 7.2 percent; both are statistically significant. Across 46 populations in Thailand and neighbouring countries, grouping by language family accounts for a small but statistically significant share of the maternal variation. Differences between populations within a language family account for about nine times as much. Across 36 northern populations compared on the maternal line, grouping by language accounts for about 1.2 percent of the variation, while differences between populations within a group account for about 11.5 percent. The study treats the linguistic boundary as a small but real influence, with random change in small populations having a greater effect.
For one group, the two kinds of evidence point in the same direction. The Nyah Kur are genetically closest to the lowland Austroasiatic groups, especially the Khmer, which also matches their linguistic classification.
Results favouring geography
A survey of the northeast using a short stretch of mitochondrial DNA covered 433 people from ten groups in the Korat and Sakon Nakhon basins. Genetic distance there followed geographic distance closely but not linguistic distance. Sorting the ten groups by basin accounts for about 4.7 percent of the variation, compared with about 0.9 percent when they are sorted by language family; the latter was not statistically significant. A comparison of three possible histories of the region favoured one in which the first split follows the two basins rather than language. Srithawong and colleagues attribute the difference between this result and their own to the different populations examined.
On the paternal line in the same 73 populations, the ordering is reversed, at 2.4 percent for region and 1.6 percent for language family, and genetic distance also follows geographic distance. Both results, however, depend on one population. Removing the Maniq, hunter-gatherers of the far south, leaves neither grouping accounting for a significant share and removes the correlation with distance altogether.
A study of Austroasiatic speakers finds geography explaining part of the pattern, with less movement through the mountainous northwest for at least the last 2,600 years. A whole-genome survey of 3,023 people from 30 populations in the region, including four Thai groups, finds that a population's position in a summary of overall genetic similarity closely matches its geographic location. The authors attribute this to distance limiting movement between groups. They also note that most populations do not group by language family, which they interpret as evidence of mixing and of communities changing language.
Mixed and negative results
A study of highland populations finds that the four language families do not correspond to their genetic structure. In a set of 26 populations typed at fifteen repeated sequences, genetic distance showed no correlation with geographic distance. Across 51 populations in Thailand and Laos, genetic distance followed none of three measures of geographic distance, one of which accounted for mountains and rivers. Fifteen repeated sequences typed in twenty northern populations likewise showed no correlation with geographic distance. Across ten Khon Mueang villages grouped into four basins, grouping by basin accounts for about 5.1 percent of the paternal variation, which is statistically significant, and about 1.6 percent of the maternal variation. Neither line shows a correlation between genetic and geographic distance in that study.
One study reports that its two methods give different results and does not choose between them. Across twelve populations, a correlation test makes genetic distance follow linguistic distance but not geographic distance. An analysis of variance using the same populations finds that neither grouping accounts for a significant share of the variation. The authors attribute the difference to the uneven composition of the Austroasiatic populations compared with the more uniform Kra-Dai set, and leave the question open.
Across 26 populations typed at fifteen repeated sequences, grouping by language family accounts for 0.34 percent of the variation and differences between populations within a family for 1.00 percent. Grouping by region accounts for 0.19 percent and differences within a region for 0.48 percent. All four are statistically significant, and the study finds that both language and geography correspond to genetic structure.
Within a single group, the two can also part company. Three Lawa villages show genetic distances that do not follow the closeness of their dialects, which differ by between 10 and 50 percent. The study attributes this to a small founding population changing the genetic picture faster than speech changes, and notes that its linguistic distances were simulated rather than measured. A later study of the same region finds no correlation with geography of either kind, across ten Lao Isan and Laotian populations typed at 23 repeated sequences and across 24 populations of the two countries typed at fifteen. Its authors compare this with the earlier maternal result and regard random change in small populations, particularly the Austroasiatic-speaking ones, as the stronger influence.
See also
- Thai people
- Ethnic groups in Thailand
- Tai peoples
- Prehistoric Thailand
References
Thailand Category:Modern human genetic history Category:Genetic genealogy Thais